The Business Case for Data Warehousing and Business Intelligence

If your finance team and your sales team report different revenue numbers for the same month, you already have a data warehousing and business intelligence problem, even if nobody calls it that yet.
A data warehouse stores and structures your company’s data, while business intelligence tools turn that data into dashboards and reports. Problems start when dashboards pull data from different sources with different logic, which leads to conflicting numbers across teams.
At Brights, we've built data infrastructure and data warehouse systems for companies where reporting had become a bottleneck, and leadership no longer trusted the numbers coming from their analytics tools. So in this article, we’ll explain what a data warehouse does, when businesses need one, what implementation costs look like, and which practices help these projects stay on track.
Key takeaways
Reporting issues usually become structural once companies work with four or more disconnected data sources, conflicting KPIs across teams, or analysts spending days assembling reports manually.
Data professionals spend 37.75% of their working time on data preparation and cleansing. For a four-person analytics team, that equals $94,464 per year spent moving and cleaning data instead of analyzing it.
A 2024 Forrester study found that companies investing in a modern analytics platform achieved a 209% ROI over three years, with a payback period under six months.
Gartner predicts 80% of data and analytics governance initiatives will fail by 2027. Teams that succeed usually start with a narrow scope, define metrics early, and connect implementation decisions to a specific business outcome.
The role of a data warehouse in business intelligence
Discussions around data warehouse vs. business intelligence usually start with tooling, although the bigger issue comes from how companies structure and govern their reporting data. The difference between a data warehouse and business intelligence comes down to the role each layer plays inside the reporting stack.
A data warehouse stores and standardizes business data from different sources. Business intelligence tools use that data for analysis, reporting, and dashboards. Together, those layers determine whether teams work from consistent metrics or spend hours reconciling conflicting numbers across departments.
| Data warehouse | Business intelligence |
|---|---|
| Stores and organizes business data from multiple sources | Uses that data for analysis, reporting, and dashboards |
| Standardizes logic and data structure | Surfaces insights for finance, sales, operations, and leadership |
| Examples: BigQuery, Snowflake, Amazon Redshift | Examples: Tableau, Power BI, Looker Studio |
| Usually managed by engineering or data teams | Usually used by analytics, finance, and operations teams |
Companies often start with a BI tool connected directly to operational systems or spreadsheet exports. Over time, disconnected sources, inconsistent naming conventions, and different update schedules create mismatched numbers across dashboards because each system applies its own logic.
Business intelligence in a data warehouse environment works because teams access the same cleaned and governed dataset across reports, exports, and dashboards. A warehouse standardizes definitions across departments and supports the long-term analysis of revenue, retention, and operational trends, which gives leadership clearer insights into business performance over time.
The main data warehouse components support different parts of the business intelligence process and help teams produce consistent insights from operational data:
ETL pipelines pull raw data from source systems, standardize it, and load it into the warehouse on a schedule. That process keeps a Monday morning dashboard aligned with the latest available business data.
The data model defines relationships between records. A customer profile connects to orders, and those orders connect to revenue by region, subscription plan, or product line.
The semantic layer stores shared business definitions, including metrics like monthly recurring revenue or active customers, so teams use the same logic across dashboards and reports.
The BI layer (Power BI, Tableau, or Looker Studio) reads from the data warehouse and turns that data into the dashboard views that analysts, finance teams, and executives use every day.
Companies often underestimate the relationship between the warehouse and the BI layer. That connection determines whether reporting supports fast decision-making or turns into an ongoing debugging process.
5 signs your business actually needs a data warehouse
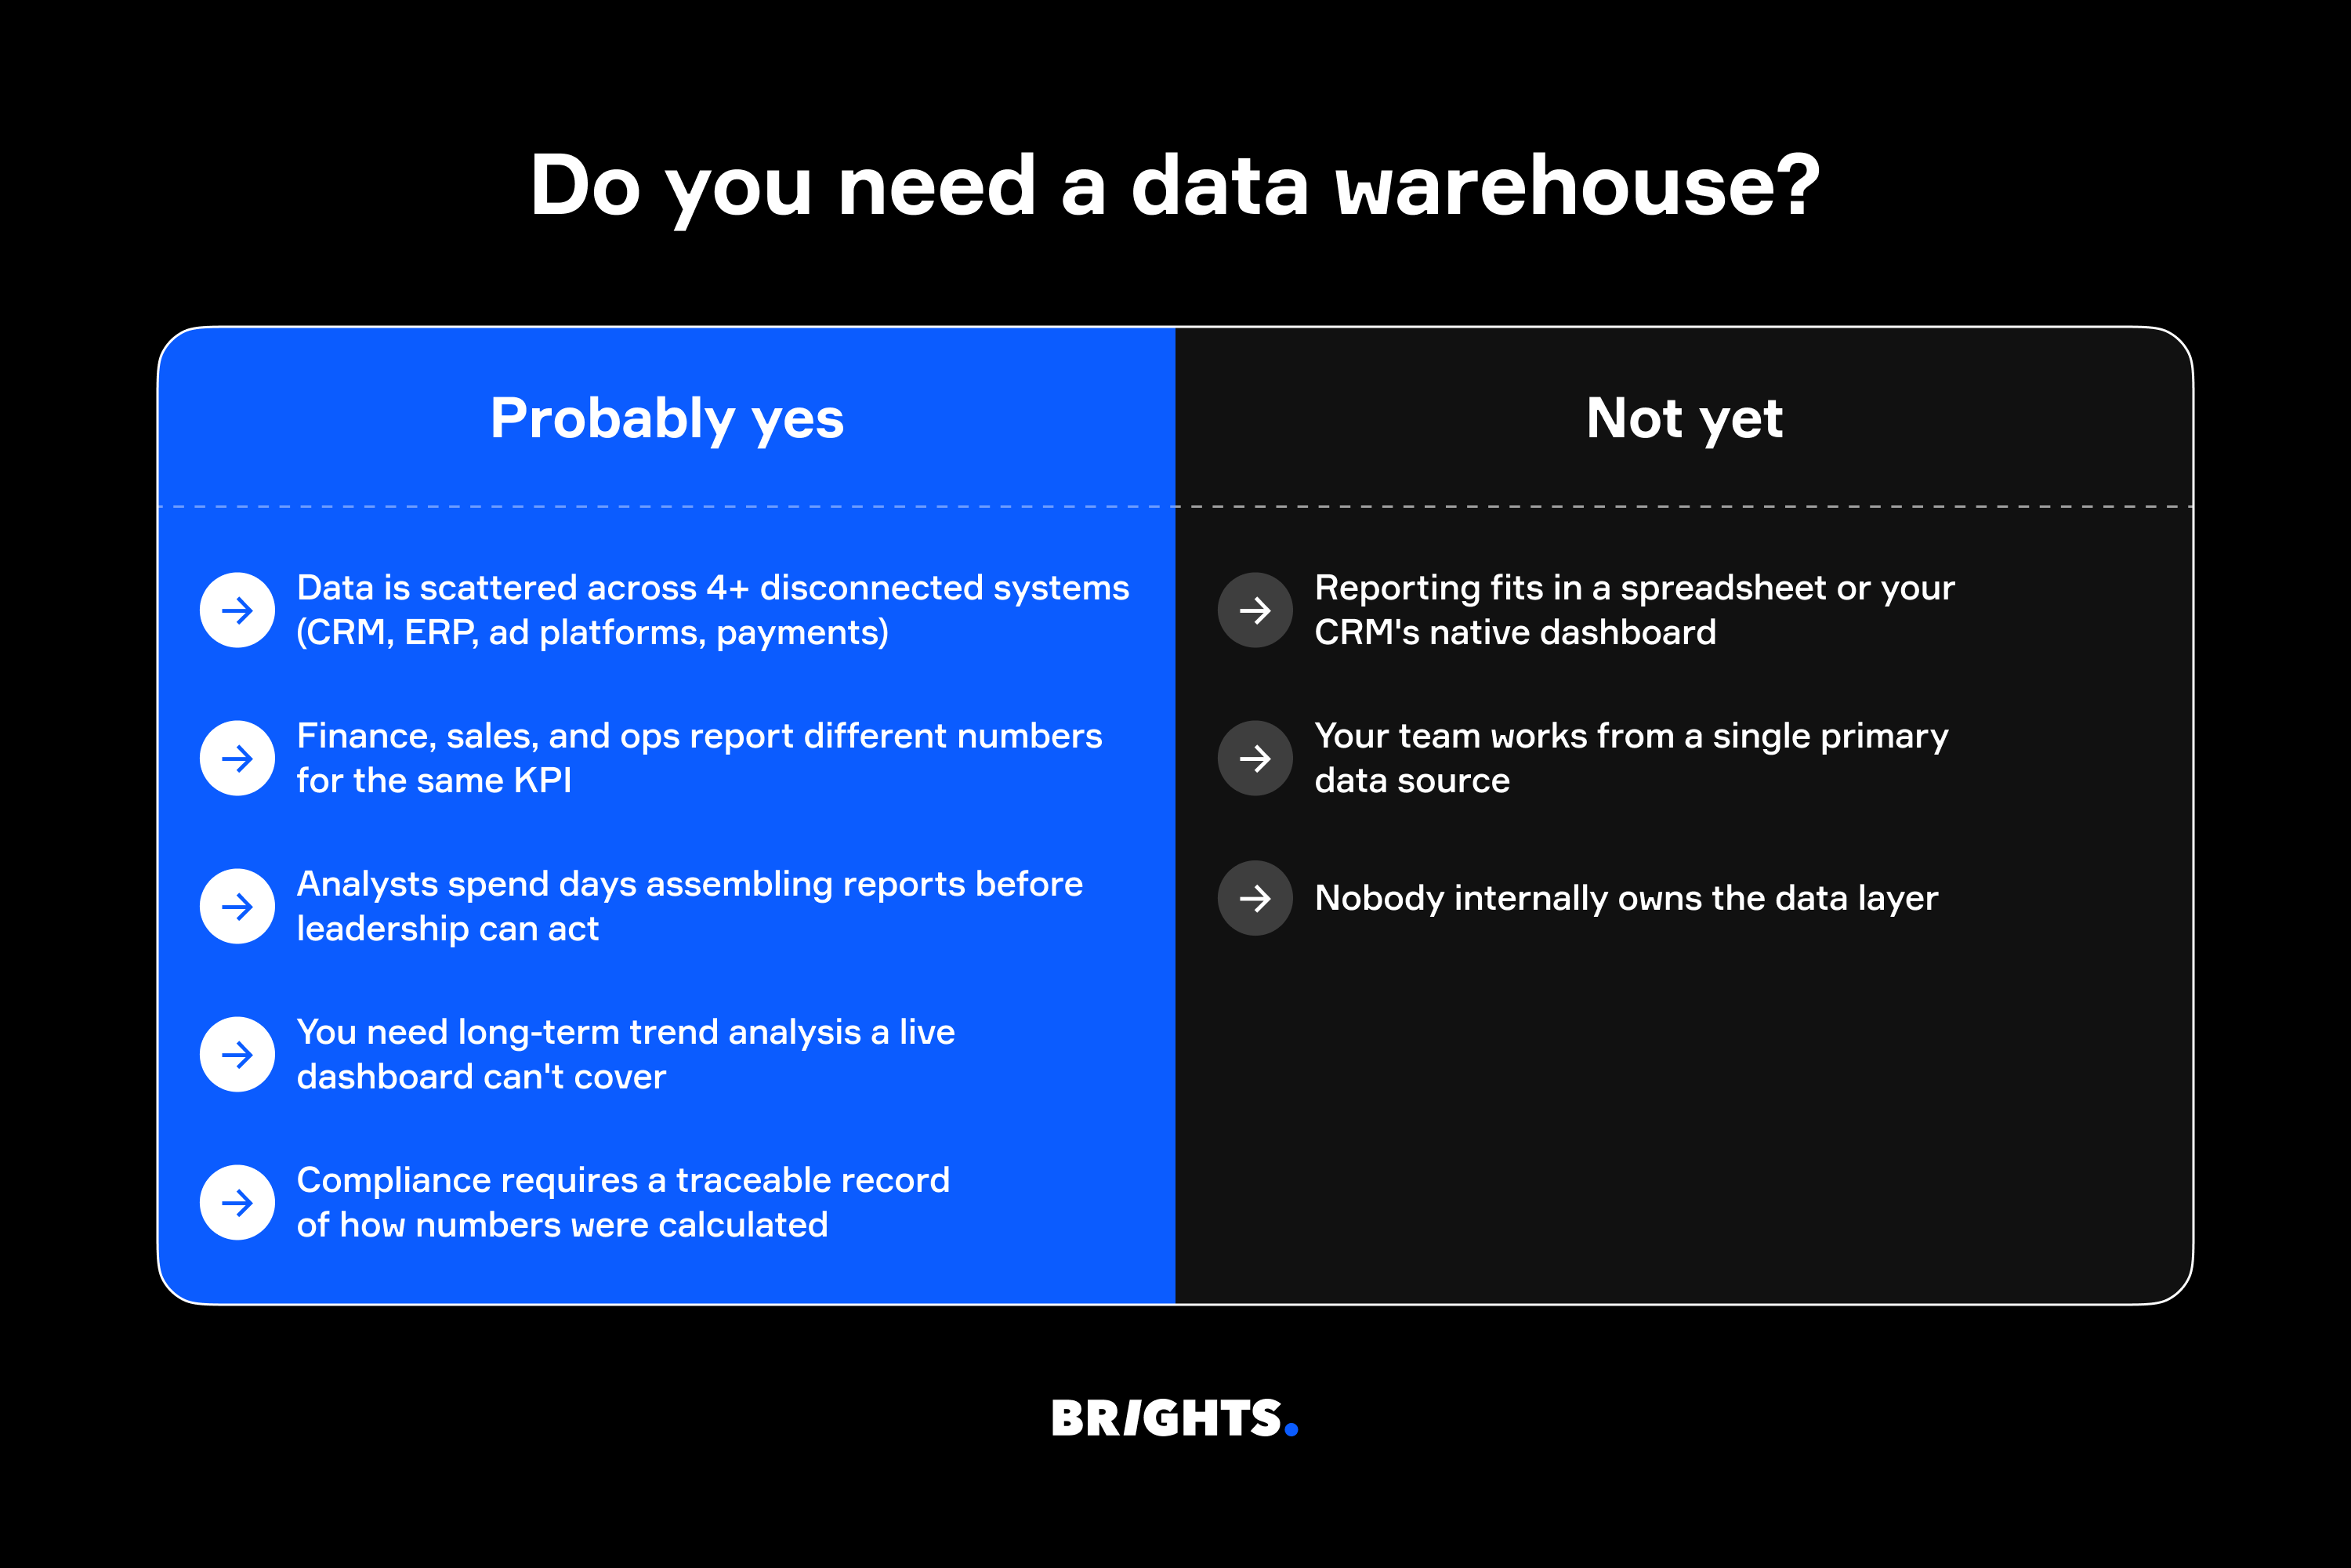
The following signals usually mean that your business does need a data warehouse:
Your data lives across several systems (CRM, ERP, ad platforms, payment processors), and teams can’t combine those sources into a consistent view of revenue or customer activity.
Finance, sales, and operations report different numbers for the same KPI during every reporting cycle. A BI platform connected to fragmented sources returns the same inconsistencies.
Analysts spend days preparing reports manually before leadership can start analysis or make decisions. Each new integration adds more manual work.
Your team needs long-term analysis of retention trends, margins, or sales cycles that go beyond the time range available in a live dashboard.
Audit or compliance requirements need a traceable record of how numbers were calculated and where the underlying data originated.
At the same time, early-stage companies with one or two data sources can usually manage reporting through a structured CRM and built-in analytics tools. So you probably don’t need a data warehouse if:
Your reporting fits inside a maintained spreadsheet or your CRM’s native dashboard, and teams work from one primary data source.
Nobody inside the company owns the data layer. In that setup, a warehouse project loses relevance quickly because the underlying logic and pipelines stop getting maintained.
A warehouse only adds extra cost and maintenance at this point.
Buying a BI tool vs. building a BI system
Off-the-shelf business intelligence tools like Power BI, Tableau, and Looker Studio help teams work with reporting data through dashboards and reports. Companies often expect those tools to fix reporting issues on their own. In reality, though, BI platforms control the reporting interface, not the underlying data structure.
Reporting problems usually appear once teams start pulling data from multiple systems. An off-the-shelf BI tool connected directly to spreadsheets, CRM exports, or operational databases still reflects inconsistent naming conventions, update timing, and calculation logic from those sources. Companies notice these issues after adding more departments, more reporting tools, or more manual exports into the workflow.
What most companies are missing isn't a different BI tool but the reporting infrastructure behind it:
Pipelines that collect and standardize data from different sources
A warehouse that stores and models the data
A semantic layer with shared metric definitions
Business intelligence tools used for reporting and analysis
Each layer supports a different part of the reporting workflow. Without that structure, inconsistencies usually move into executive dashboards, board reporting, and operational metrics.
One of Brights’ clients, a custom software development agency, was already using Looker Studio before working with us. The reporting setup still created delays and conflicting numbers:
Marketing and sales spent 2–3 days during each reporting cycle exporting data manually from five separate platforms
Different departments relied on separate sources for the same metrics
Teams paused meetings to verify numbers manually in Excel
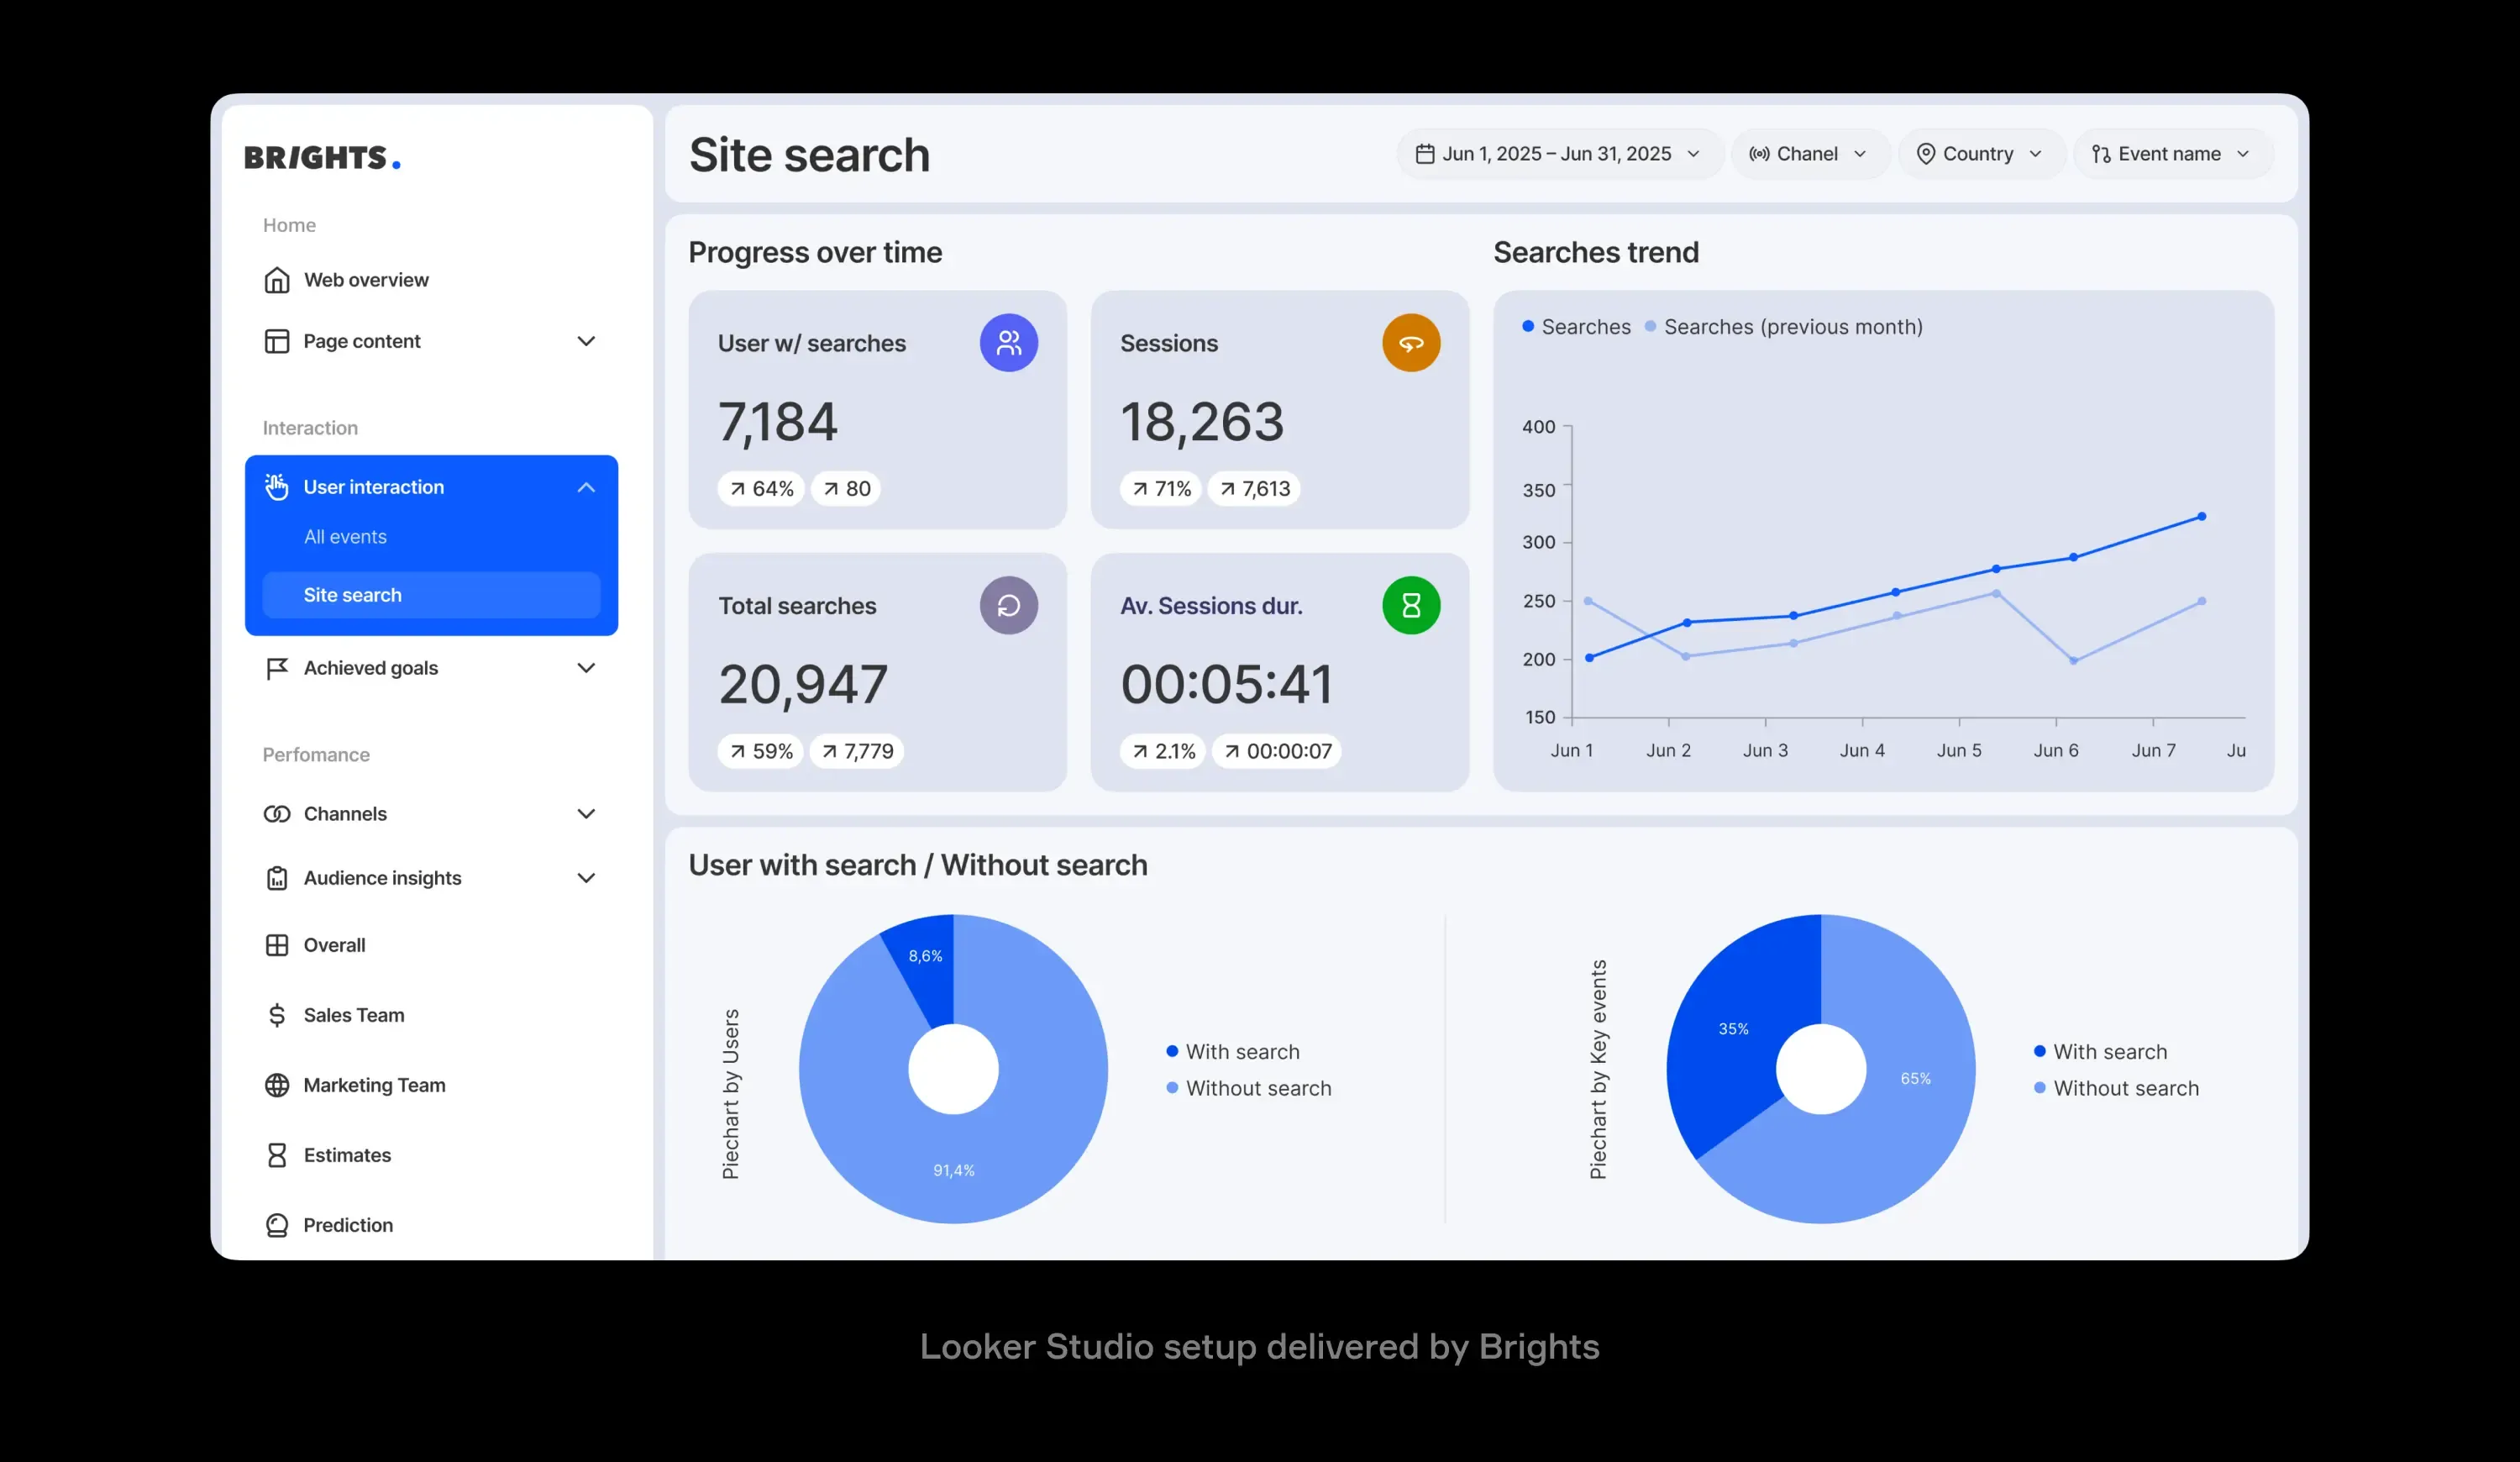
We rebuilt the underlying reporting layer using a hybrid architecture: direct Looker Studio connections for web analytics data and a PostgreSQL database for HubSpot and finance reporting. Around 80% of the data flows became automated.
In the end, the company kept the same BI platform because the issue came from the reporting structure underneath it.
BI implementation costs, maintenance, and ROI
BI and data warehousing implementation usually includes four cost categories: the warehouse platform, BI licenses, implementation work, and ongoing maintenance.
To help you estimate implementation costs, we collected published vendor pricing and combined it with estimates based on industry practice. Final costs depend on your data volume, user count, business logic complexity, and the number of data sources involved.
| Component | Typical cost | Notes |
|---|---|---|
| Cloud warehouse (BigQuery, Snowflake, Redshift) | Varies by usage | |
| BI tool licenses (Power BI, Tableau, Looker) | $9–$75/user/month | |
| Implementation (pipelines, data model, semantic layer) | $20,000–$80,000 | Estimate based on industry practice. Costs vary depending on data sources and reporting complexity |
| Ongoing maintenance | 15–25% of the build cost annually | Covers pipeline updates, data model changes, and BI layer adjustments |
BI implementation costs become easier to justify once companies compare them with the cost of manual reporting work. A 2024 Forrester study estimated the fully burdened annual salary of a data analyst at $170,000, or about $82/hour. If four analysts spend 24 hours each month pulling and merging data, the company spends $94,464 per year before anyone produces insights.
4 analysts × 24 hours/month × $82/hour × 12 months = $94,464/year in analyst time alone
Anaconda's 2022 State of Data Science report found that data preparation and cleansing accounted for 37.75% of a data professional’s working time. The report gives finance and analytics leaders a clearer picture of how much paid analyst time goes into preparing data before any reporting work starts.
Forrester also modeled the financial impact of a modern analytics platform across a composite organization. Over three years, the model showed a 209% ROI and a payback period below six months. The largest gains came from $2.5 million saved on data preparation work and another $1.1 million tied to analyst time.
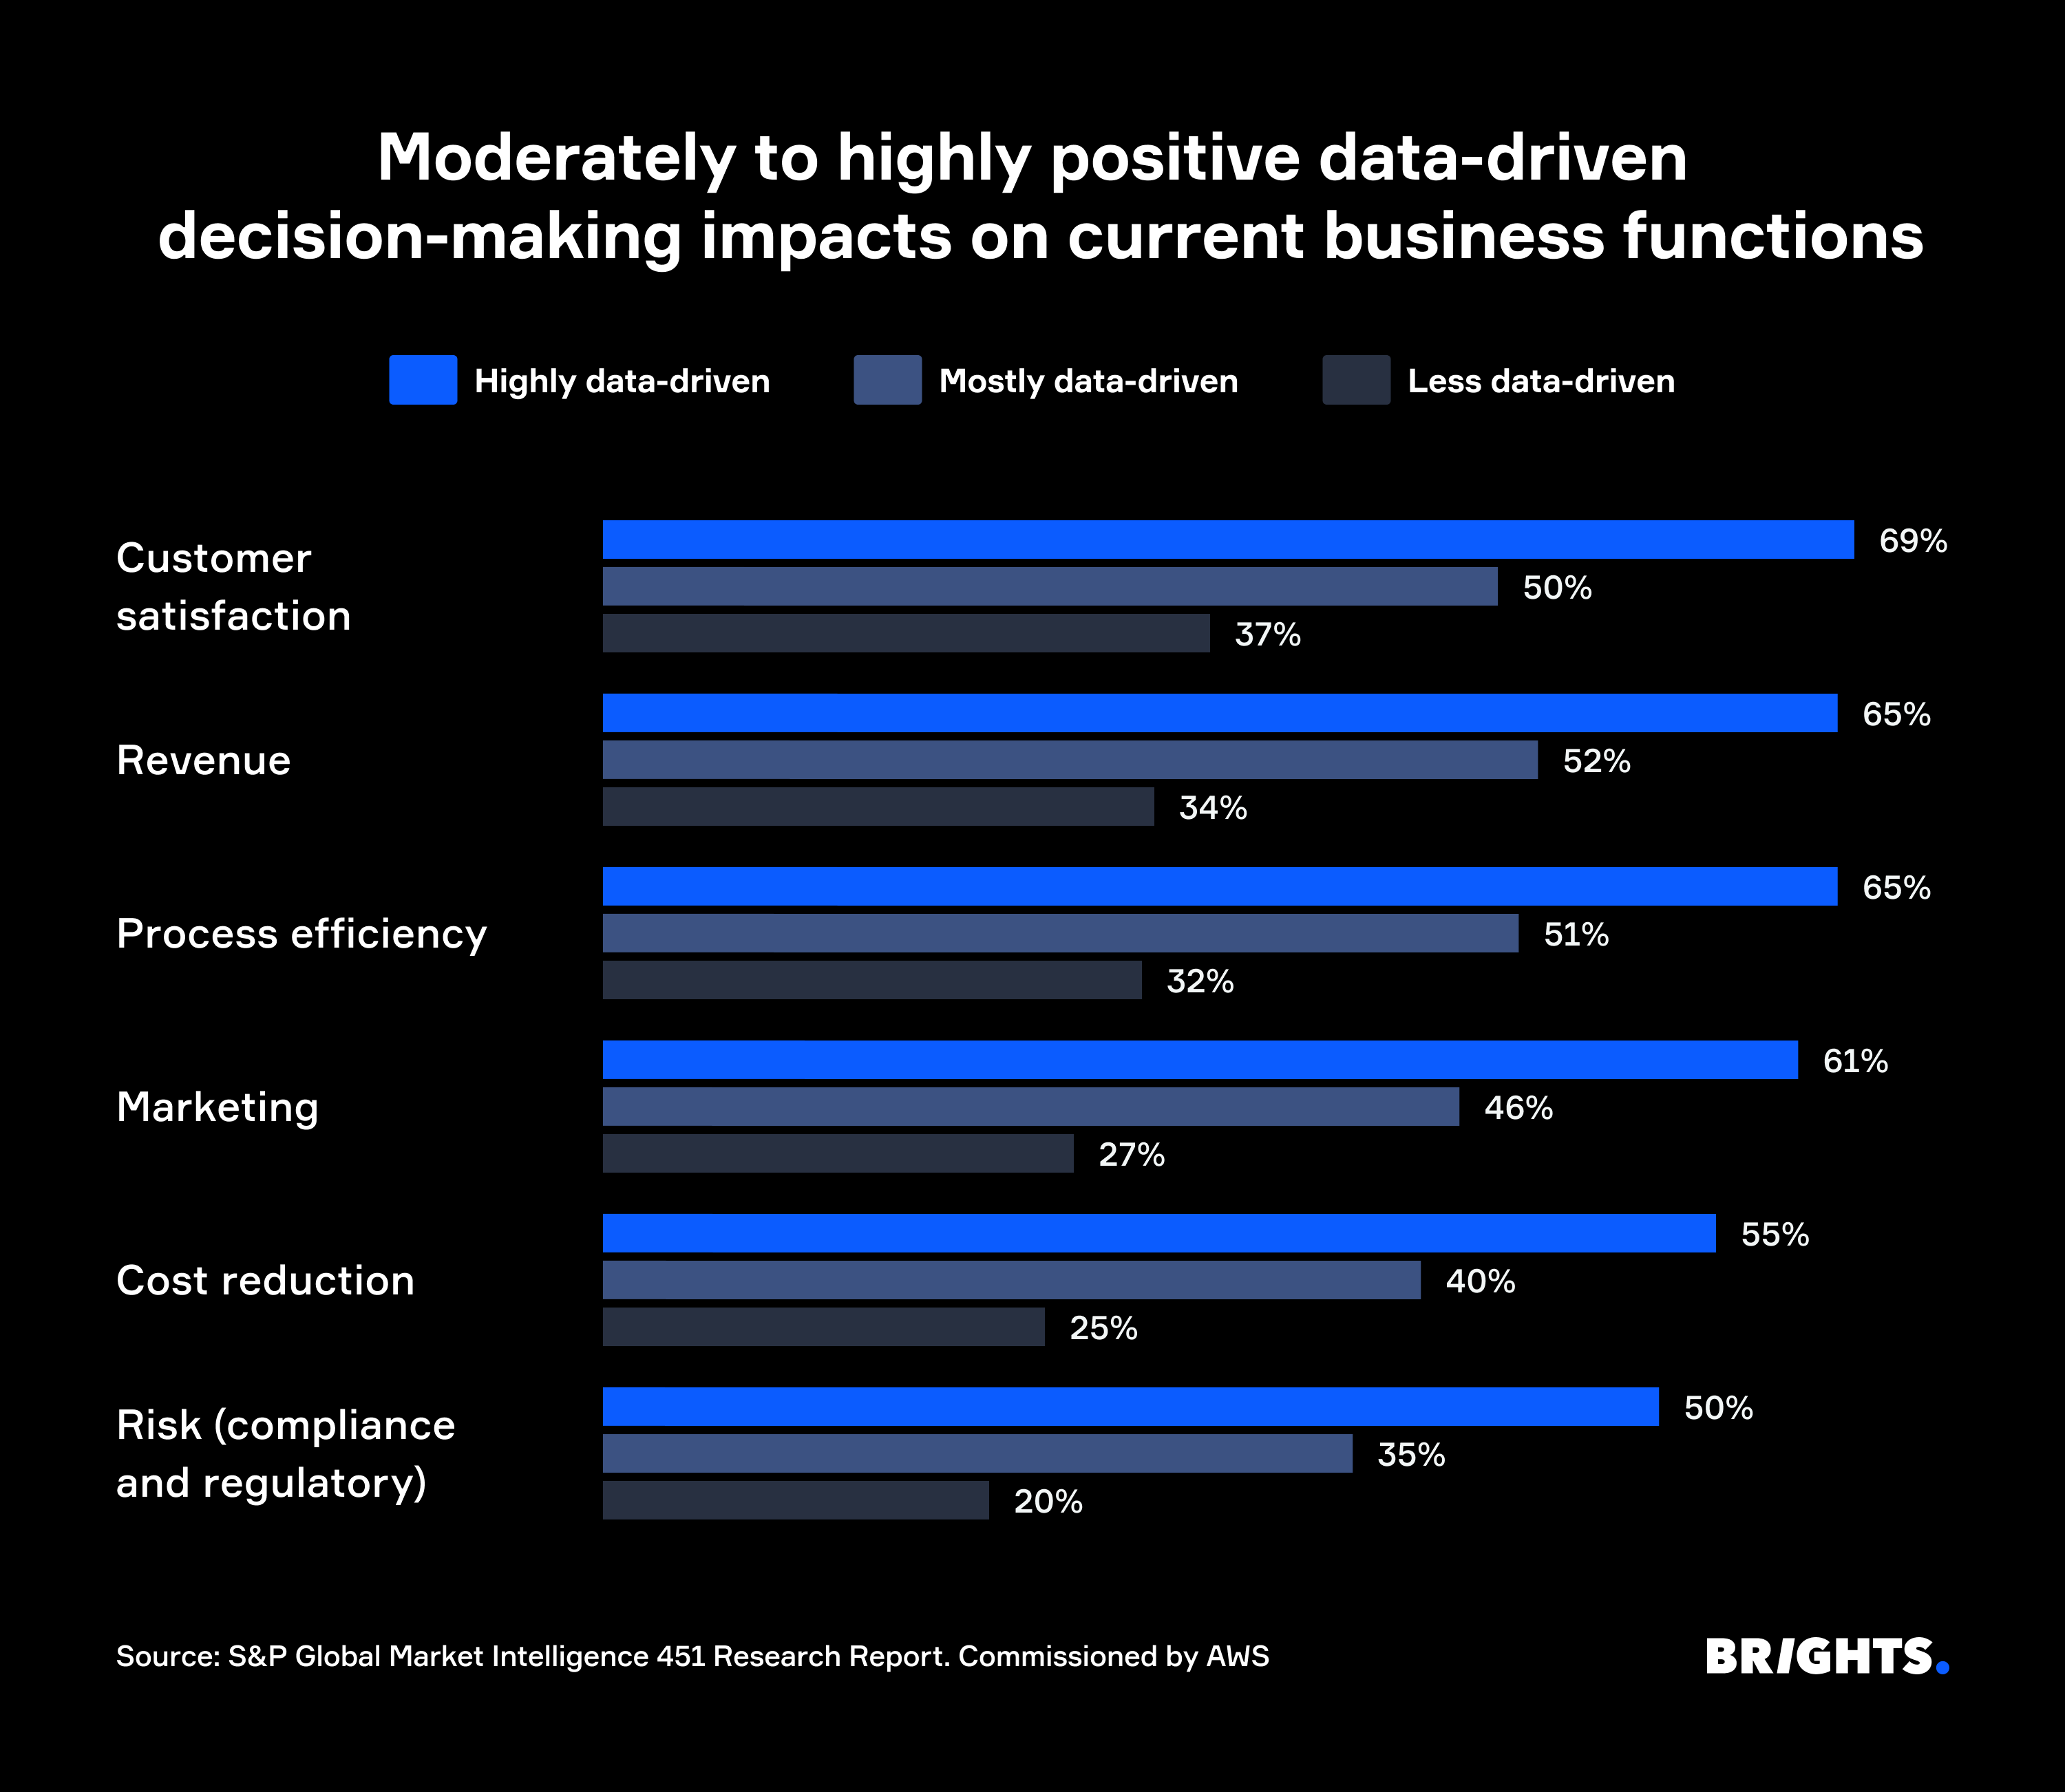
But labor savings only explain part of the return. A 2024 study by 451 Research and S&P Global commissioned by AWS tracked 2,362 SMBs and found that highly data-driven companies were almost twice as likely to financially outperform competitors. Among those companies, 65% reported moderate or significant outperformance, compared with 33% of less data-driven businesses. Companies with a comprehensive data strategy reported financial outperformance in 60% of cases, compared with 24% among companies still building their approach.
Best practices in business intelligence and data warehousing
Gartner predicted in February 2024 that 80% of data and analytics governance initiatives will fail by 2027 because they lack a clear connection to business outcomes. The issue usually comes from implementation decisions, governance, and adoption, not the technology itself.
Based on our experience with BI and data warehousing implementations, a few practices consistently help teams avoid reporting issues that appear later in the project.
Align KPI definitions before implementation
Terms like “monthly recurring revenue,” “active customer,” and “qualified lead” often mean different things across finance, sales, and operations. Teams should agree on metric definitions before anyone builds pipelines or reporting logic.
Misalignment at this stage leads to reporting that works technically but produces inconsistent numbers across departments. And fixing those issues after implementation usually costs more time and money.
Start with one or two use cases
Focus on the reporting issue that creates the biggest operational problem first:
Conflicting sales numbers
Manual monthly close processes
Delayed campaign analysis
A focused MVP gives teams usable reporting within weeks and makes internal adoption easier than a large warehouse rollout with no visible output for months.
Budget for adoption alongside implementation
Implementation cost is only part of the investment. Training, documentation, and feedback collection during the first 90 days affect how teams use the system in daily decision-making. Without that support, employees often return to spreadsheets and manual reporting workflows.
Separate the data layer from the reporting layer
Your BI platform should read data from the warehouse only. Direct connections between reporting tools and operational systems like CRM or ERP platforms create maintenance problems when those systems change.
Plan for changes over time
Reporting requirements change as companies expand into new markets, launch products, or add data sources. KPI definitions also evolve. Maintenance costs should exist as part of the operating budget from the beginning, especially for businesses that expect ongoing changes in reporting and analysis needs.
Conclusion
Companies usually start investing in data warehousing and business intelligence after reporting problems begin affecting day-to-day operations. Finance, sales, and operations stop trusting the same numbers, analysts spend hours validating exports manually, and reporting cycles slow down as more data sources get added to the workflow. BI tools alone can’t fix fragmented data sources or inconsistent reporting logic.
In most cases, the challenge comes from implementation decisions, not from the technology itself. Reporting architecture becomes difficult to maintain when teams define metrics differently, connect dashboards directly to operational systems, or treat the data layer as a one-time implementation instead of an ongoing part of the reporting process.
FAQ.
A focused BI and data warehousing implementation with one or two data sources usually takes 6–12 weeks from discovery to a working dashboard. Projects with multiple data sources, custom integrations, or compliance requirements often take 3–6 months.

