The Business Impact of Data Integration in Looker Studio

The companies pulling ahead in today's market aren't necessarily the ones with bigger budgets. They're the ones making faster, smarter decisions, particularly through effective data integration in Looker Studio and similar unified platforms. While competitors struggle with fragmented data from dozens of disconnected tools (CRM, Ads, GA4, Stripe, etc.) that create blind spots and slow decision-making, market leaders spot trends in real-time and adjust strategies immediately. This speed advantage compounds over time, creating significant gaps in market position and profitability.
With data integration through Looker Studio, executives see business performance as it happens, instead of waiting for end-of-month reports. Business dashboards Looker Studio setups reveal which initiatives drive results before competitors even recognize the opportunity exists. Marketing campaigns get optimized mid-flight, product decisions accelerate based on user behavior patterns, and resource allocation improves continuously rather than quarterly.
At Brights, through numerous implementations of Looker Studio for business, we've seen companies reduce decision-making cycles from weeks to days while improving outcome accuracy. This Google Looker Studio overview reflects real-world experience helping businesses transform reporting into a forward-driving competitive advantage.
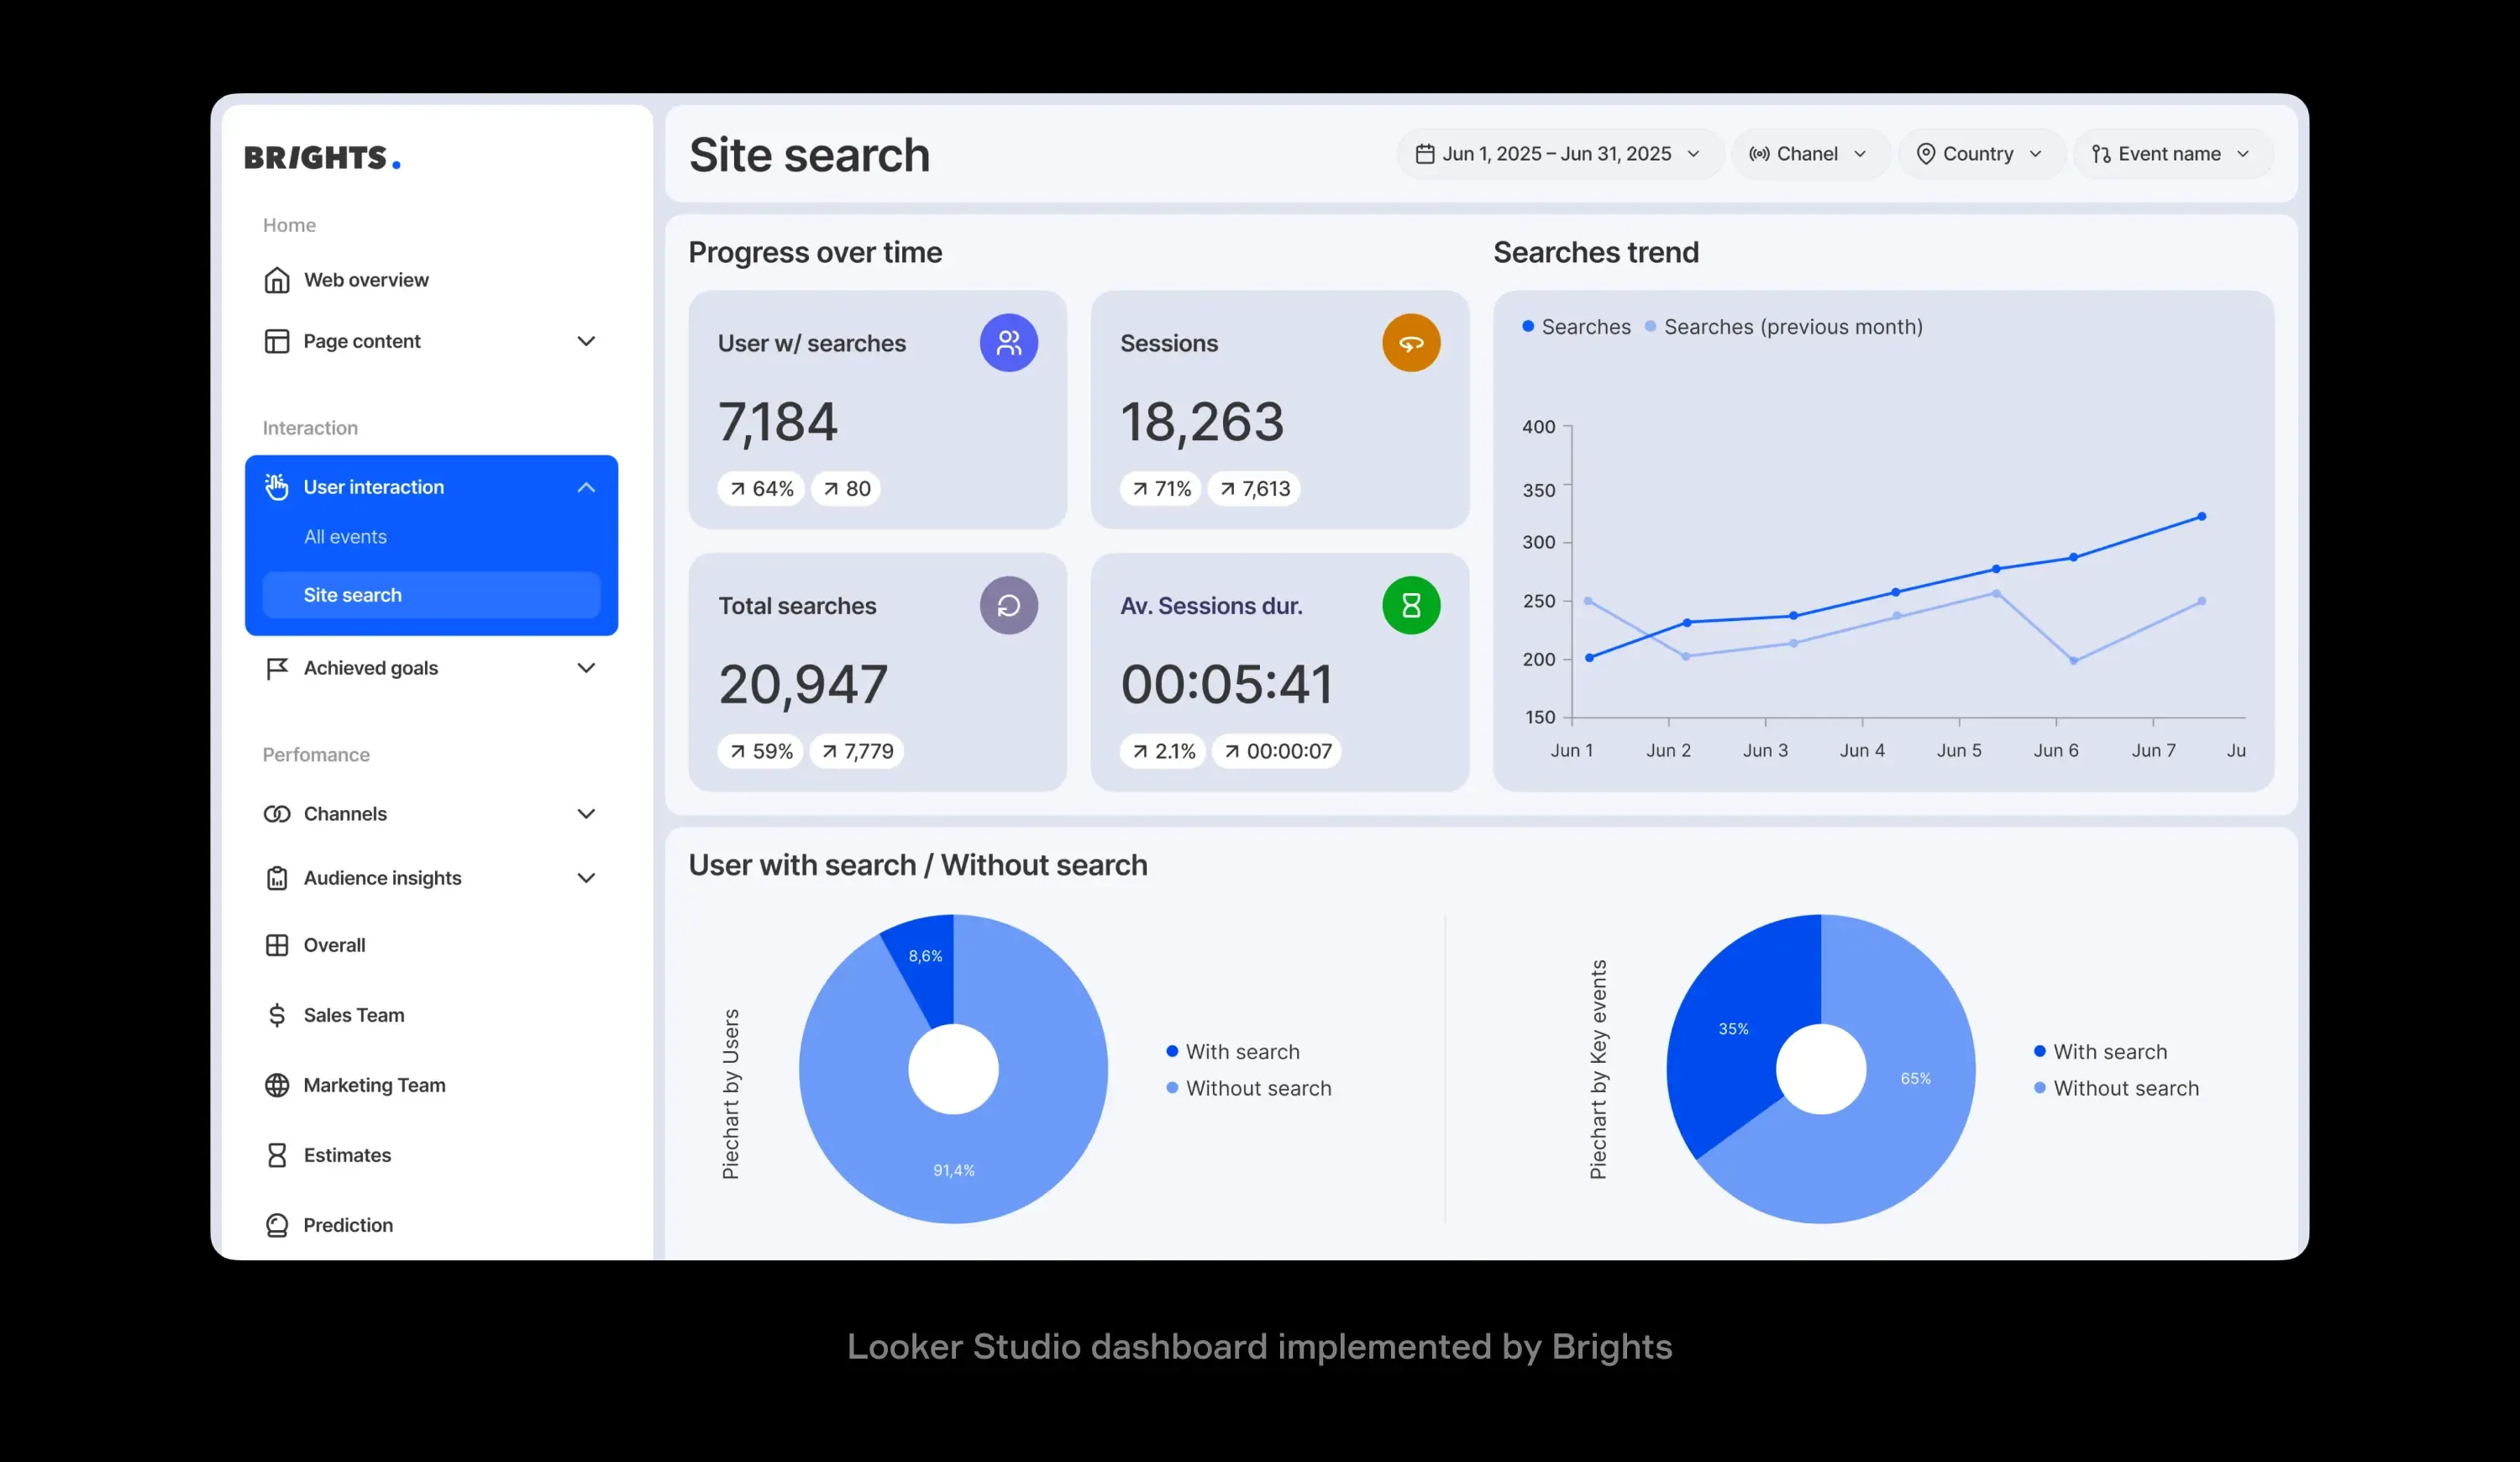
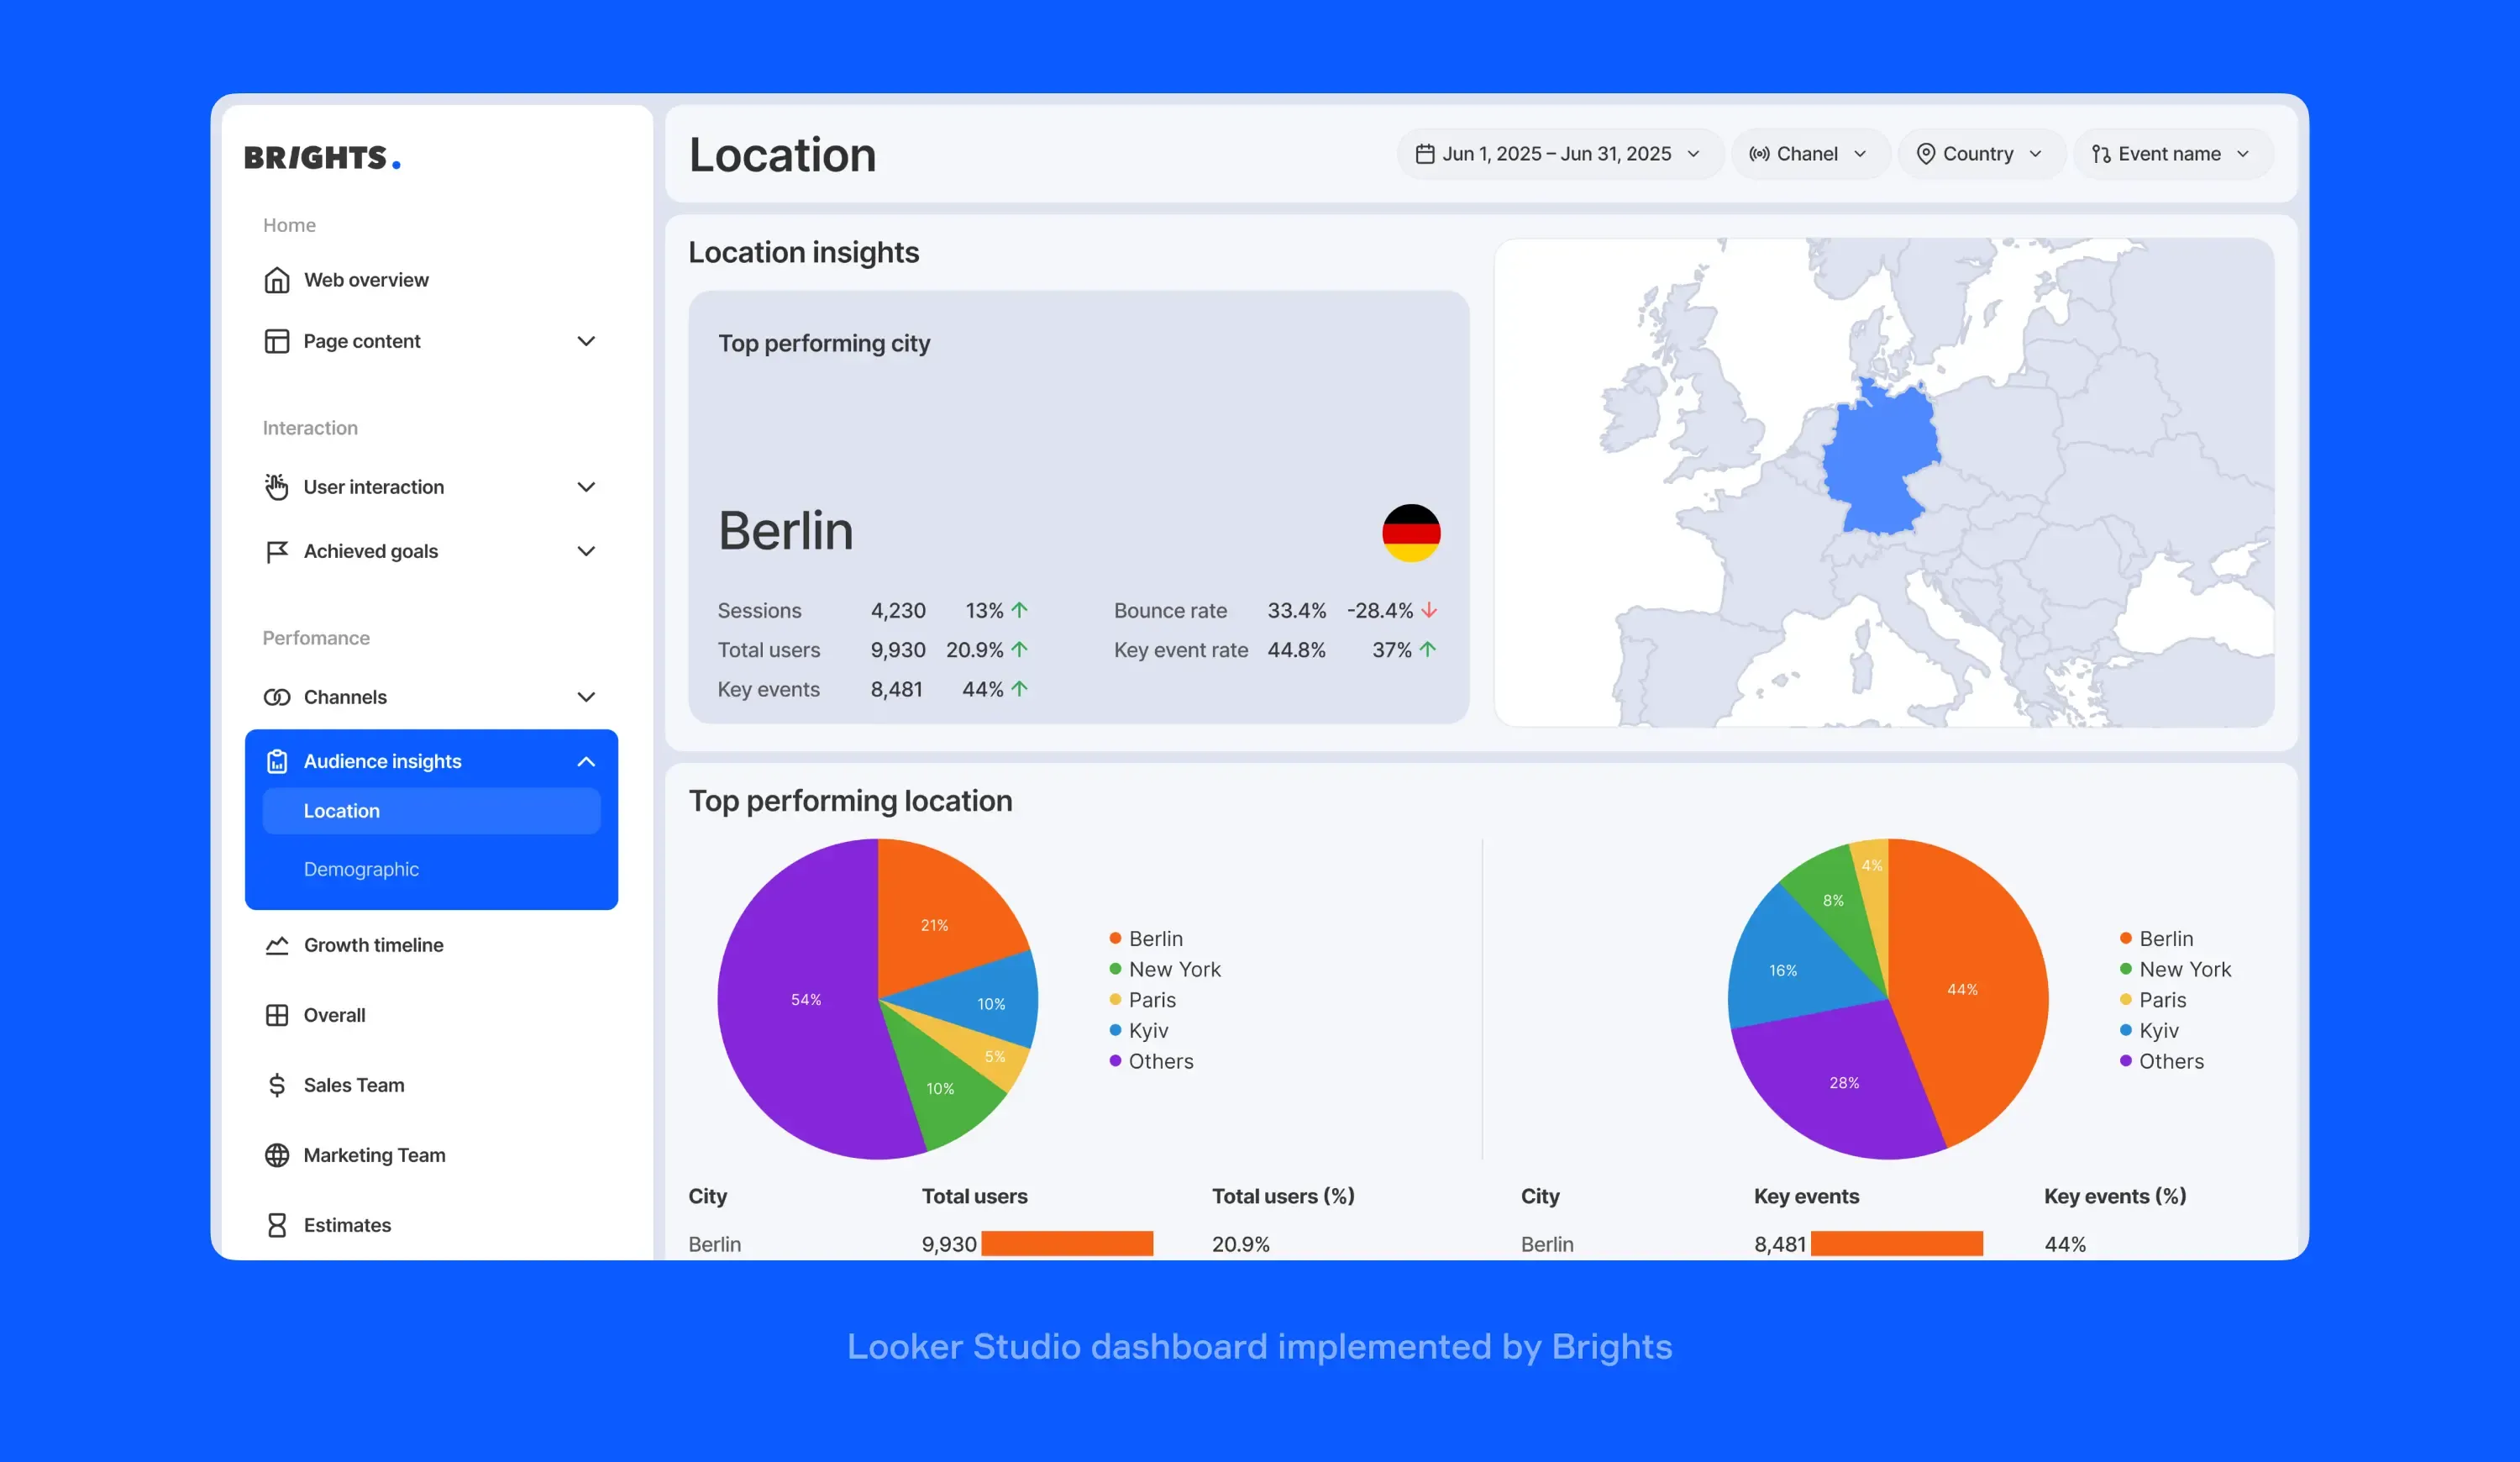
Looker Studio dashboard implemented by Brights
Key takeaways
The rule of thumb when setting up analytics dashboards is to start with 3-5 critical business questions that impact revenue or growth, then connect only the data sources needed to answer those questions.
Unified dashboards reveal hidden ROI patterns, often showing that expensive marketing channels deliver the lowest customer lifetime value.
Real-time reporting creates competitive speed advantages: while competitors spend days on monthly reports, integrated dashboards let teams spot trends and optimize strategies within hours.
Expert dashboard implementation handles data translation, error monitoring, and security while training internal teams for independence.
The cost of data silos for businesses
Here is a hypothetical scenario for you. Imagine a marketing team celebrates a 40% increase in app installs from their latest campaign. However, at the same time, the finance and product teams see the subscription revenue grow just 8% that same month, while churn rates spiked among supposedly high-quality leads. So, what’s the deal here?
Data silos in analytics manifest consistently across departments, creating a disconnected picture that undermines strategic decisions:
Marketing tracks impressions and clicks but can't see which campaigns drive actual subscription renewals;
Finance monitors revenue streams without visibility into which acquisition channels produce profitable customers;
Product teams analyze feature usage without understanding connections to marketing spend or customer lifetime value.
In 2025, IBM's Study of 2,000 global CEOs found that 68% of executive officers identify integrated enterprise-wide data architecture as critical for cross-functional collaboration. Yet, 50% acknowledge that their organization has disconnected technology.
When departments operate from different versions of the truth, reporting challenges emerge as teams waste time reconciling spreadsheets instead of making strategic decisions. Employees manually export data while optimizing metrics in isolation, missing the bigger picture that drives growth. This fragmentation leads to expensive mistakes like launching unwanted products, investing in unprofitable marketing channels, or cutting retention-critical costs.
Looker Studio as a solution for unified data
Looker Studio serves as a practical integration hub that connects your existing business tools without requiring you to replace them. As Google's free business intelligence platform, it is designed to transform disconnected data sources into interactive, shareable dashboards. Looker Studio's reporting solution pulls data from CRMs, advertising platforms, and financial systems to create unified business dashboards that enable confident decision-making.
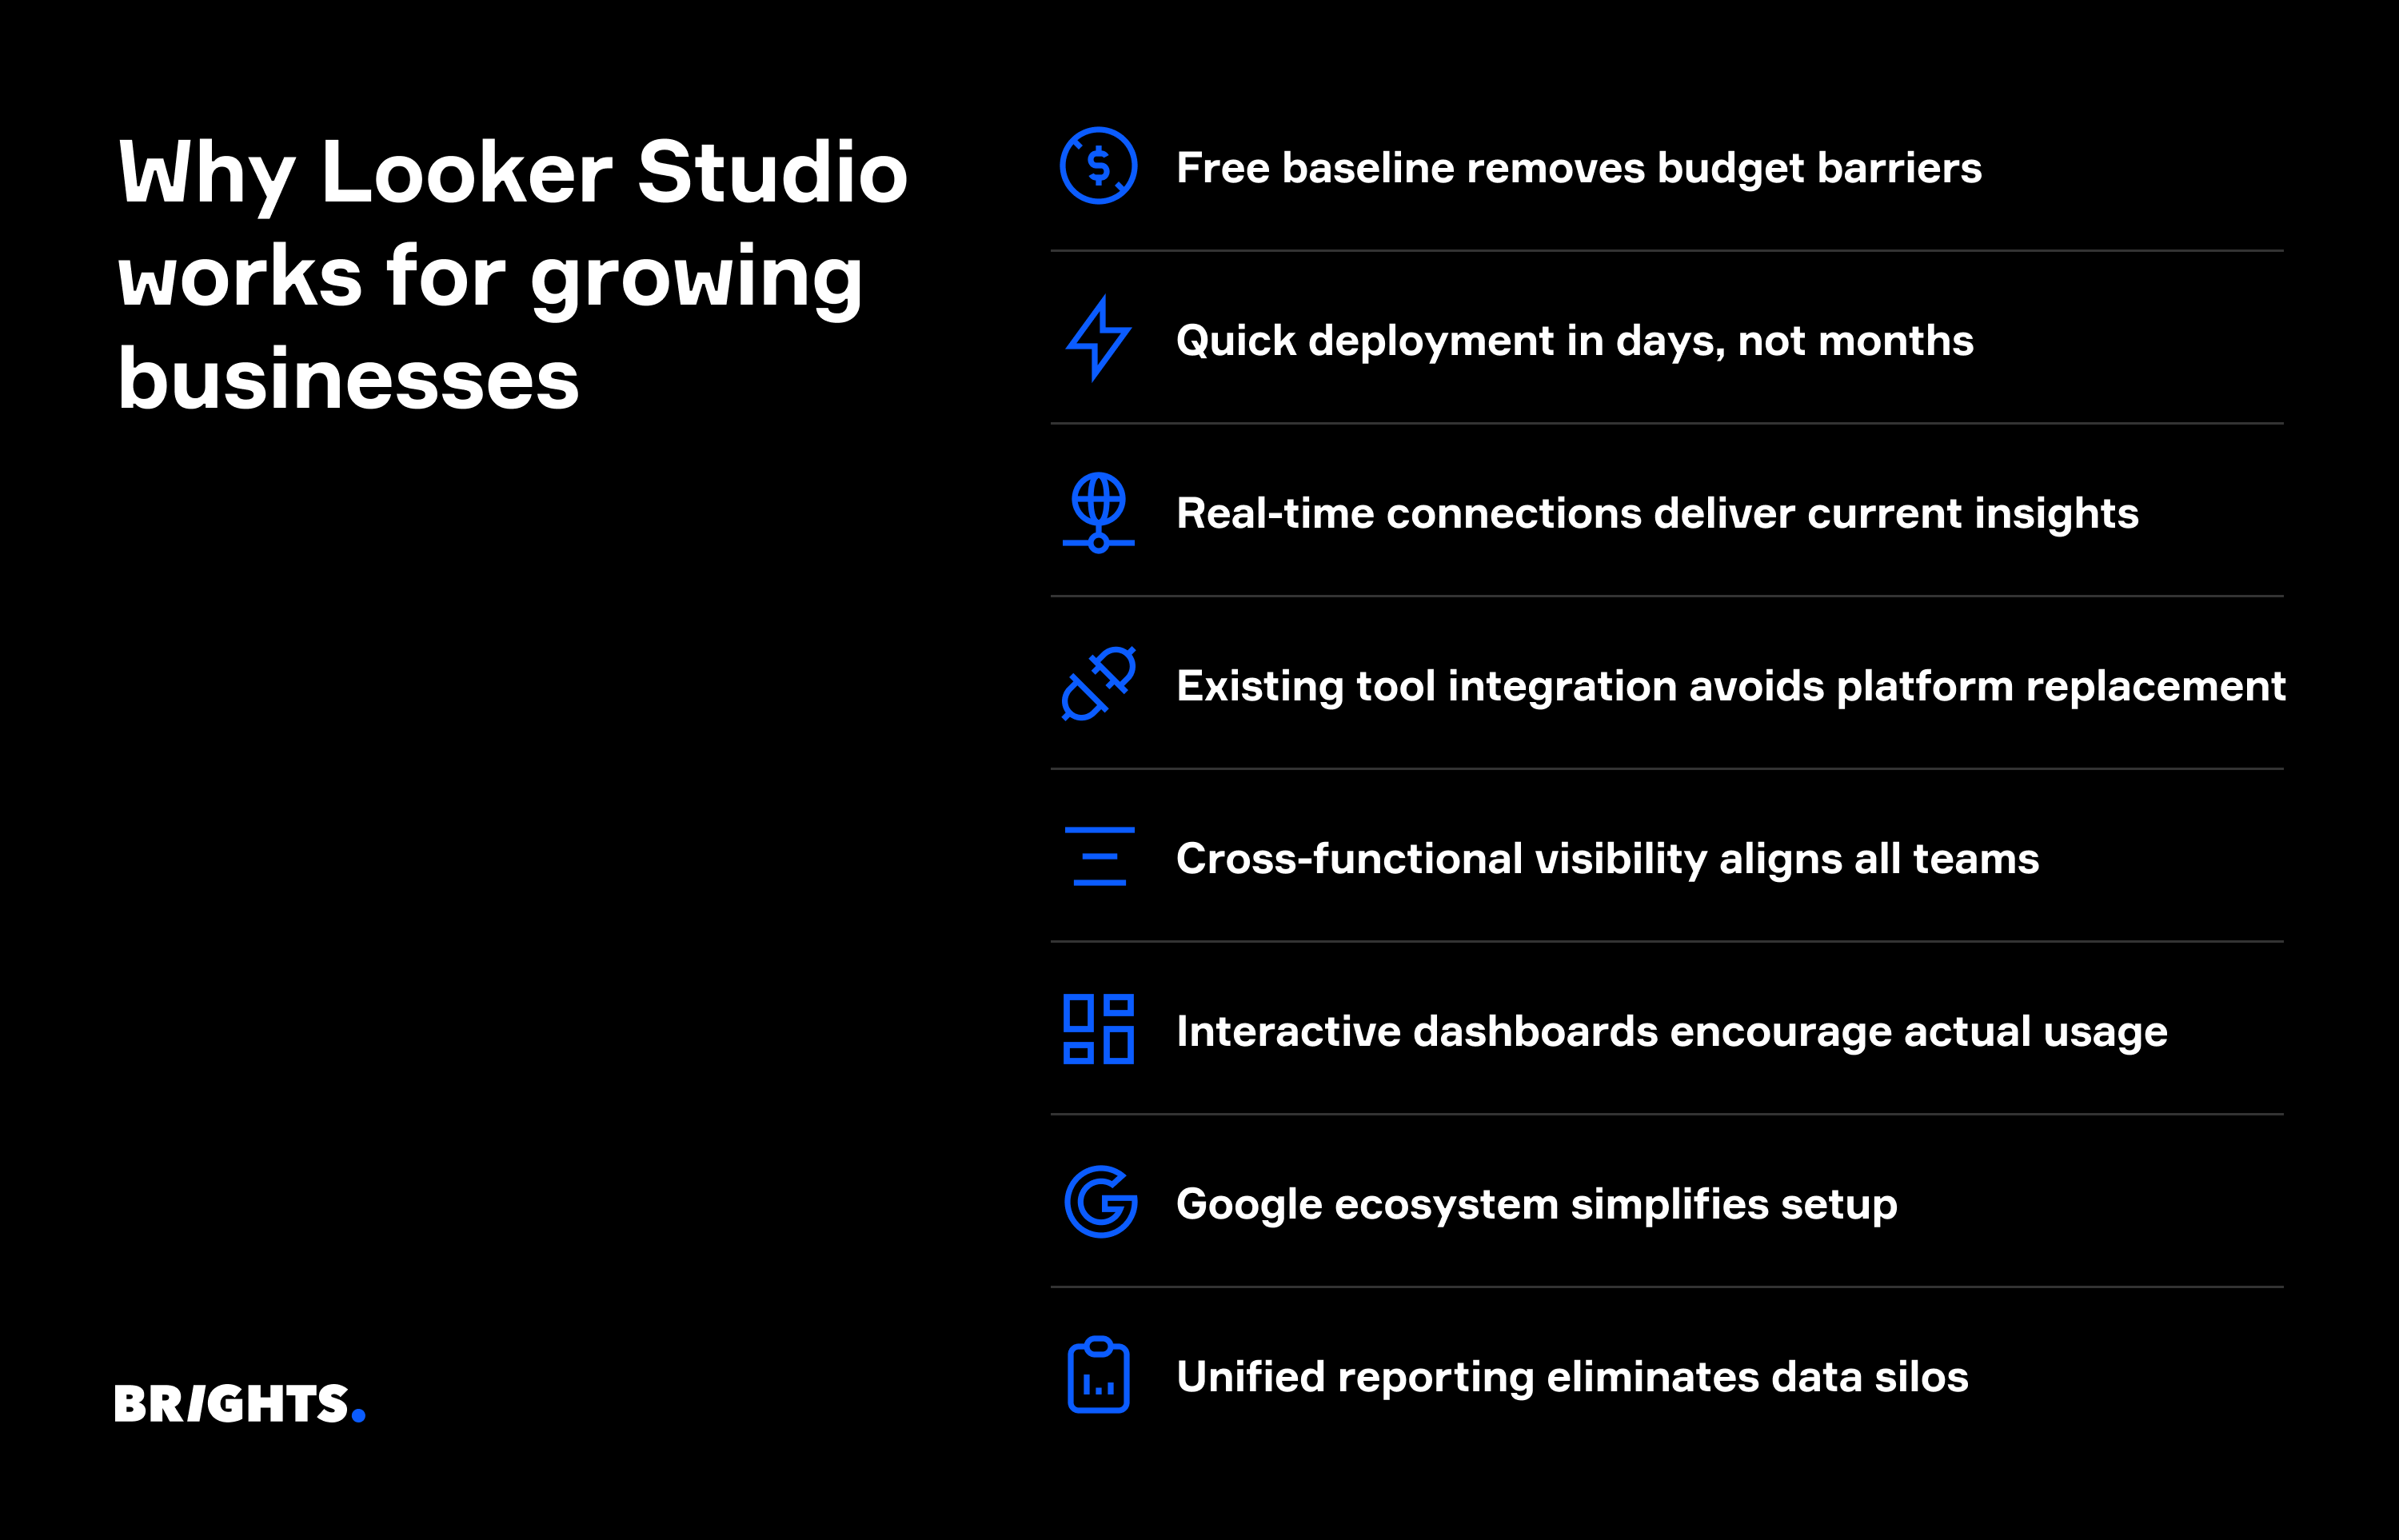
Why business dashboards Looker Studio setups work for scaling:
Cost-effective entry point: Free baseline version removes budget barriers that delay analytics projects.
Rapid deployment: Looker Studio implementation takes weeks or even days, not months, especially with Google ecosystem tools.
Real-time integration: Data Integration in Looker Studio connects live data sources for up-to-date business insights.
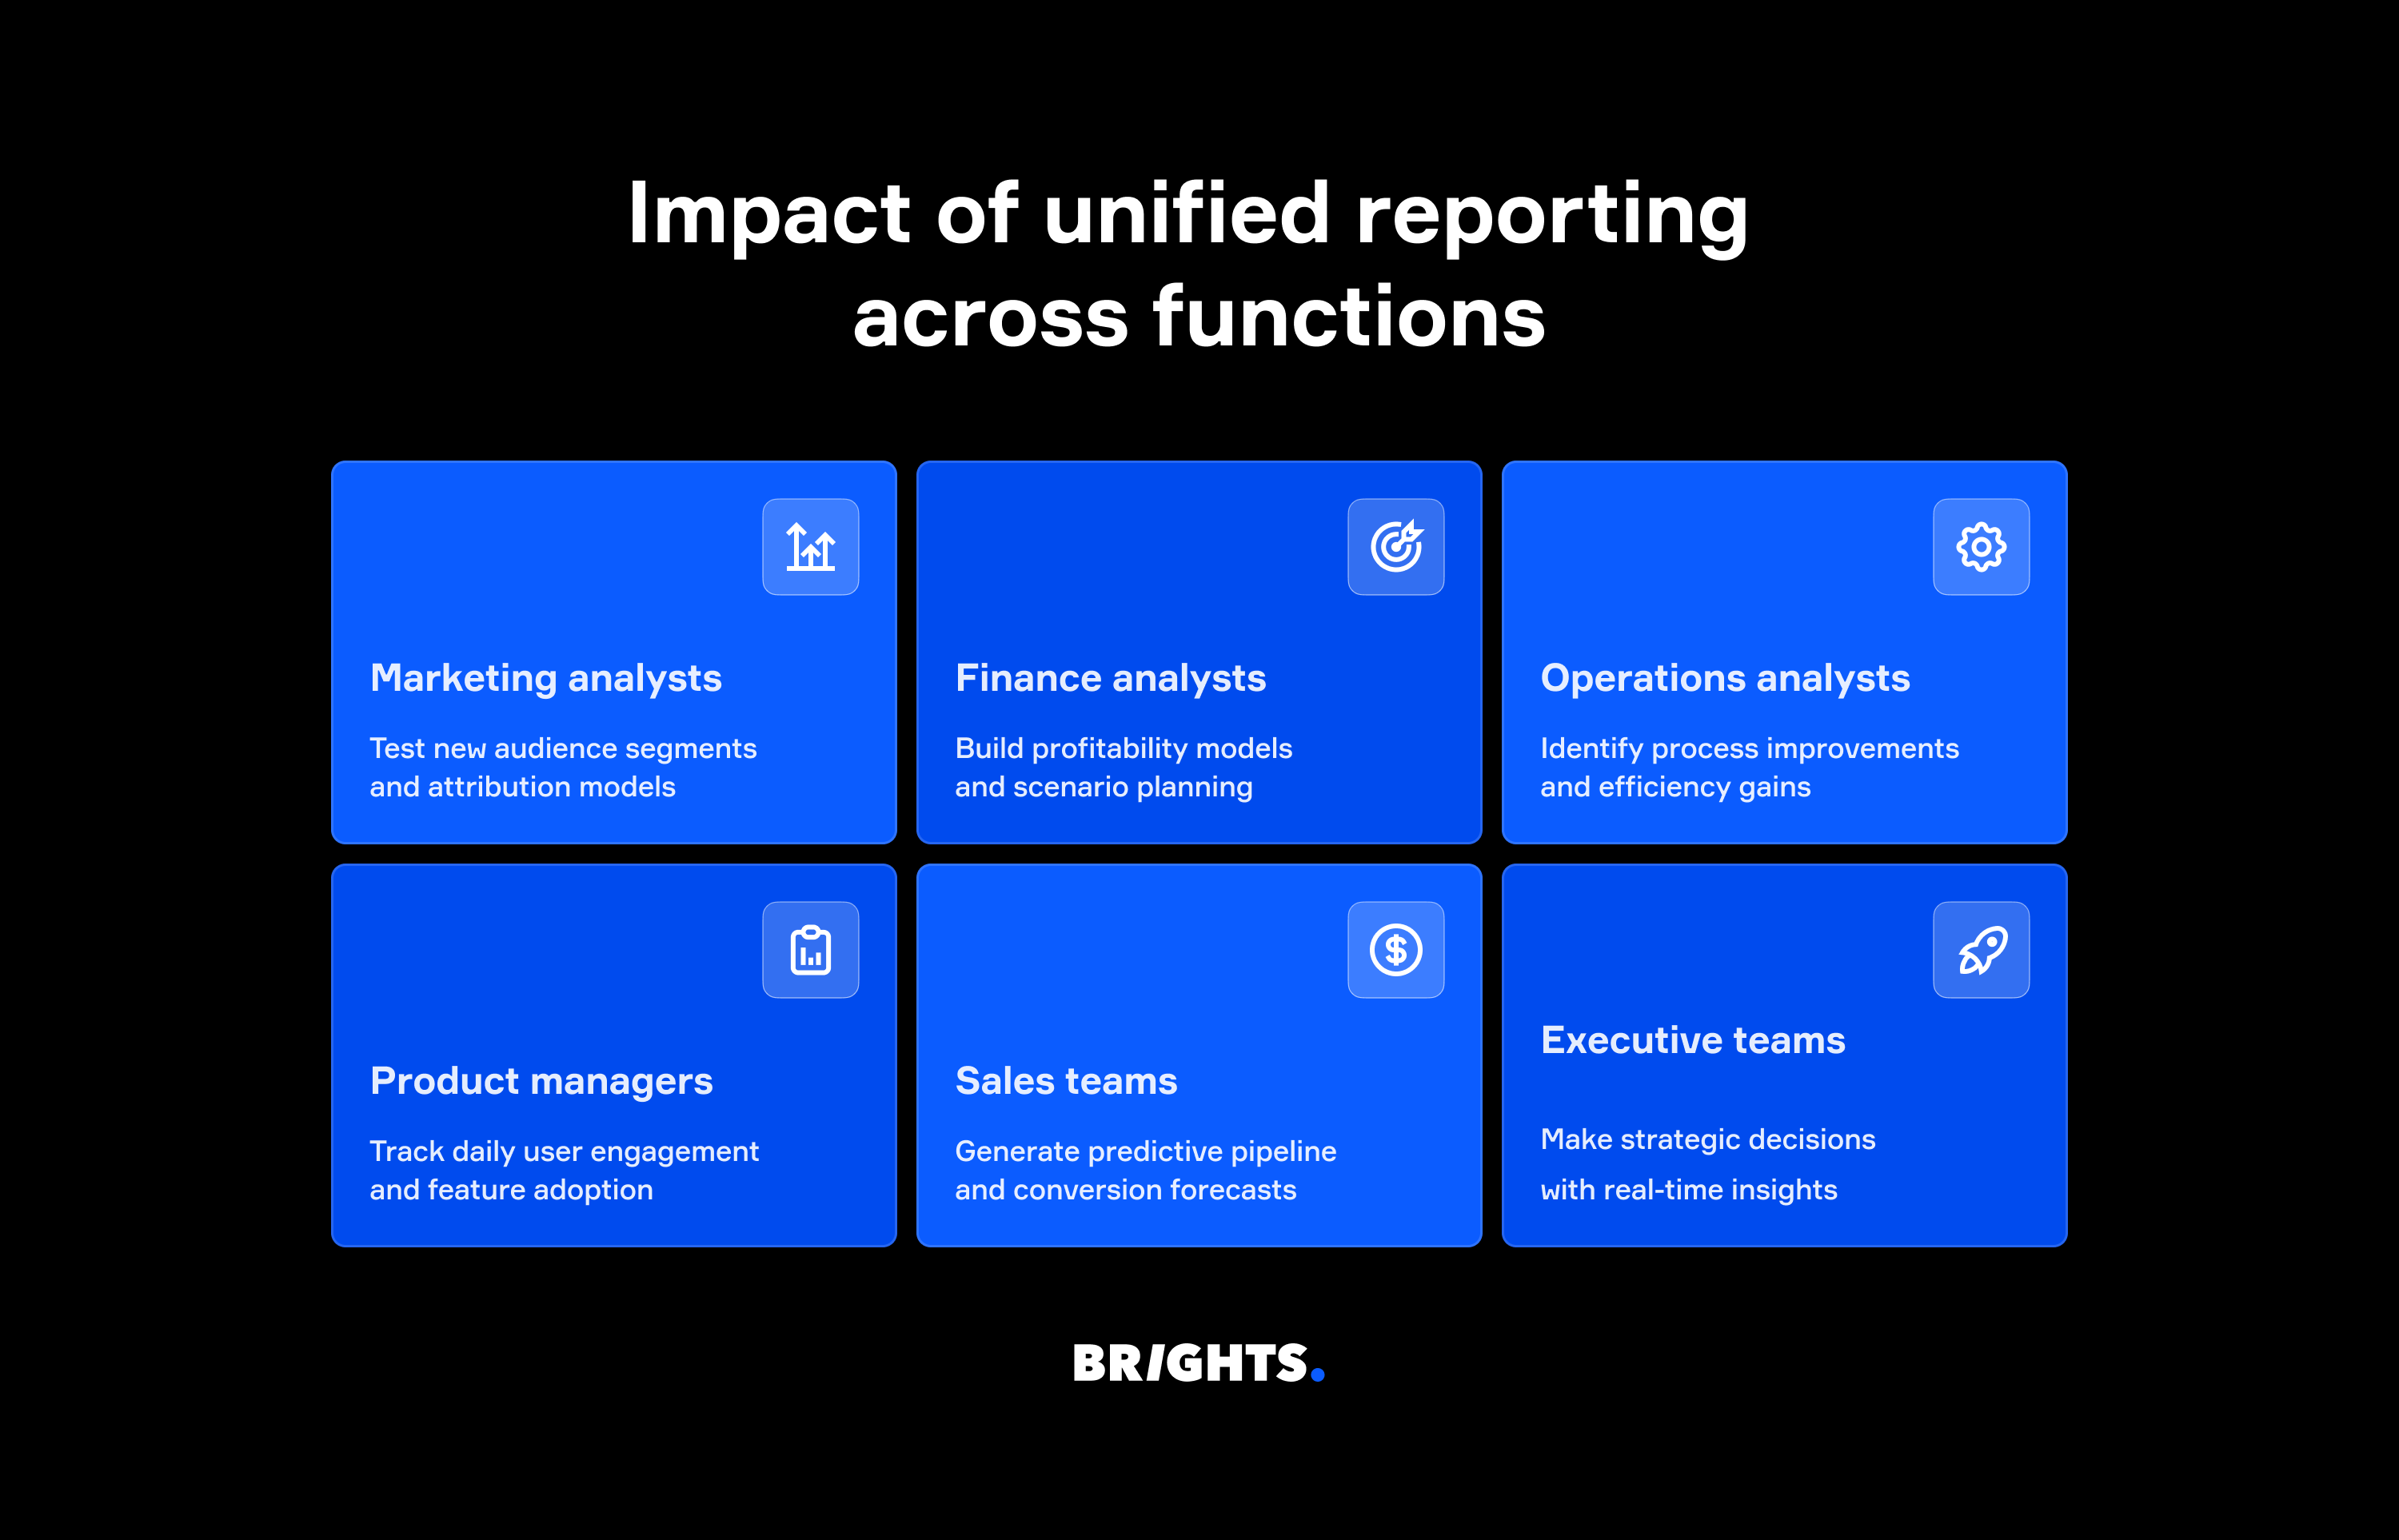
Cross-functional visibility: Marketing, finance, and product teams can see how their activities connect to overall business outcomes.
The platform's strength lies in making fragmented data accessible rather than storing it. Your Looker Studio reporting tool becomes the lens through which departments view shared metrics, creating alignment where data silos once created confusion.
The implementation reality: Success depends on proper preparation. Data quality, consistent naming conventions, and strategic dashboard design determine whether you get meaningful business intelligence.
Business impact dimension 1: ROI uplift
Unified data transforms how businesses understand and optimize their financial performance across industries and business models. When marketing spend connects directly to customer lifetime value (LTV), companies stop wasting money on channels that deliver poor returns.
Looker Studio enables this connection by bringing together advertising costs, conversion data, and revenue tracking in real-time dashboards. Consider how this revelation typically unfolds:
Without integration: Each channel appears successful in isolation. Google shows strong click-through rates, LinkedIn delivers quality leads, and content drives engagement. True ROI remains invisible because acquisition costs don't connect to long-term customer value.
With integrated insights: LinkedIn generates customers with 3x higher LTV despite higher upfront costs, Google Ads attracts users who churn within three months, creating negative ROI, and content marketing drives the highest-value prospects with longer conversion cycles.
Immediate optimization opportunities
Attribution clarity enables budget optimization with integrated data that pays for itself immediately. Companies routinely discover they can shift spending from high-volume, low-value campaigns to premium channels, reducing blended customer acquisition costs by 30-50% while maintaining growth targets. Dashboard views reveal which features correlate with retention, enabling marketing to target prospects more likely to engage with sticky functionality.
Business impact dimension 2: Faster, smarter decisions
The contrast between manual reporting cycles in Excel and automated dashboards reveals why speed determines market position.
| Traditional reporting | Automated dashboards |
|---|---|
| Data collection: Analysts spend days pulling from multiple systems | Data collection: Automatic updates from integrated sources |
| Reconciliation: Hours spent matching inconsistent formats | Consistency: Unified definitions eliminate reconciliation |
| Delivery: Weekly or monthly reports with outdated insights | Access: Real-time performance is visible instantly |
| Decision timing: Strategy based on 1-2 week old information | Decision timing: Strategic action based on current data |
Automation creates a productivity multiplier effect across data teams. Instead of spending 80% of their time on data preparation, analysts focus on interpretation, trend analysis, and strategic recommendations. Data professionals transform from report generators into strategic advisors who identify growth opportunities.
Let’s talk specifics. Consider a growing SaaS company where the CFO waits until mid-month for revenue reports, making budget decisions based on six-week-old data, while the product manager compiles a quarterly retention analysis that gets outdated before it reaches stakeholders. Partnering with experienced SaaS application development consultants helps such companies design scalable analytics architectures and automate reporting pipelines that connect product, finance, and marketing data into one unified Looker Studio environment.
With automated dashboard integration, the CFO reviews real-time cash flow each morning and adjusts spending based on current performance, while the product manager tracks daily cohort metrics and identifies a 15% onboarding conversion drop within 48 hours. This enables immediate optimization instead of discovering problems months later during quarterly reviews. Subsequently, faster decisions enable rapid experimentation, continuous optimization, and market responsiveness.
Business impact dimension 3: Alignment across teams
The most expensive debates in growing companies aren't about strategy but about which numbers are correct. When teams operate with different data sources, organizations waste time arguing about metrics instead of acting on insights.
Data fragmentation creates predictable conflicts that drain organizational energy and slow down decision-making, whereas unified dashboards foster data alignment around shared metrics.
| Working with fragmented data | Working with unified dashboards |
|---|---|
| Sales vs. marketing: Sales celebrates lead volume while marketing questions lead quality, creating campaign effectiveness tensions | Sales + marketing alignment: Both teams see lead volume and conversion quality in unified attribution reports, eliminating effectiveness debates |
| Finance vs. product: Finance reports declining unit economics while product teams point to engagement growth, leading to conflicting priorities | Finance + product alignment: Shared dashboards connect engagement metrics to revenue impact, showing how product improvements affect unit economics |
| Customer success vs. product: Customer success identifies satisfaction issues while product teams see positive usage metrics, preventing customer journey reporting dashboards from clarifying product-market fit | Customer success + product alignment: Integrated dashboards reveal which usage patterns correlate with satisfaction scores, clarifying product-market fit |
Strategic decision-making with integrated insights
Collaboration improves drastically when teams reference consistent analytics for planning and evaluation. Consider a typical product prioritization challenge where marketing wants prospect-requested features, support teams advocate for ticket-reducing functionality, and product managers push engagement innovations.
Without integrated data, decisions become political rather than strategic. However, when combined tracking from marketing attribution, support tickets, and user behavior feeds into shared dashboards, teams make evidence-based trade-offs.
Smart sharing and access control
Effective sharing capabilities, combined with appropriate roles and filters, ensure that teams access relevant information without being overwhelmed by excessive detail or compromising data security. The result transforms strategic planning from data accuracy debates to productive discussions about strategic options based on trusted insights.
Risks & challenges in data integration
Even well-planned projects hit obstacles that can derail progress or create expensive problems down the road. Let’s go over the most common pitfalls that catch teams off guard.
Bad connectors create ongoing headaches: Free or cheap connectors often break without warning when APIs change, leaving teams without current data for decisions. To address this, you need to invest in enterprise-grade connectors with SLA guarantees and monitoring.
Duplicate data confuses decisions: Inconsistent data formats across systems create duplicate records and conflicting metrics, making accurate reporting impossible. As a solution, implement data cleaning protocols and unique identifier mapping before building dashboards.
Hidden costs accumulate quickly: “Free” Looker Studio setups in reality require premium data connections, additional storage, and monthly fees of $200-500 for reliable connectors. Therefore, you need to plan the total cost of ownership upfront, including all necessary premium features.
Poor schema design limits growth: Rushed initial setup without proper data structure makes adding new sources nearly impossible, forcing complete rebuilds when scaling. To deal with it, you need to design a flexible schema architecture that accommodates future data sources.
Why expert Looker Studio setup services pay off
Professional Looker Studio setup services might seem redundant — after all, the tool is free and has a relatively low entry point in terms of tech proficiency. But there's a critical gap between connecting data sources and building dashboards that drive decisions. Say, your accounting system calls revenue “Net sales,” while your CRM uses “Closed won value,” and your marketing platform tracks “Cost per click” when financial reports need “Customer acquisition cost.” Expert services handle this translation layer, creating consistent data definitions, so dashboards show unified, trustworthy numbers.
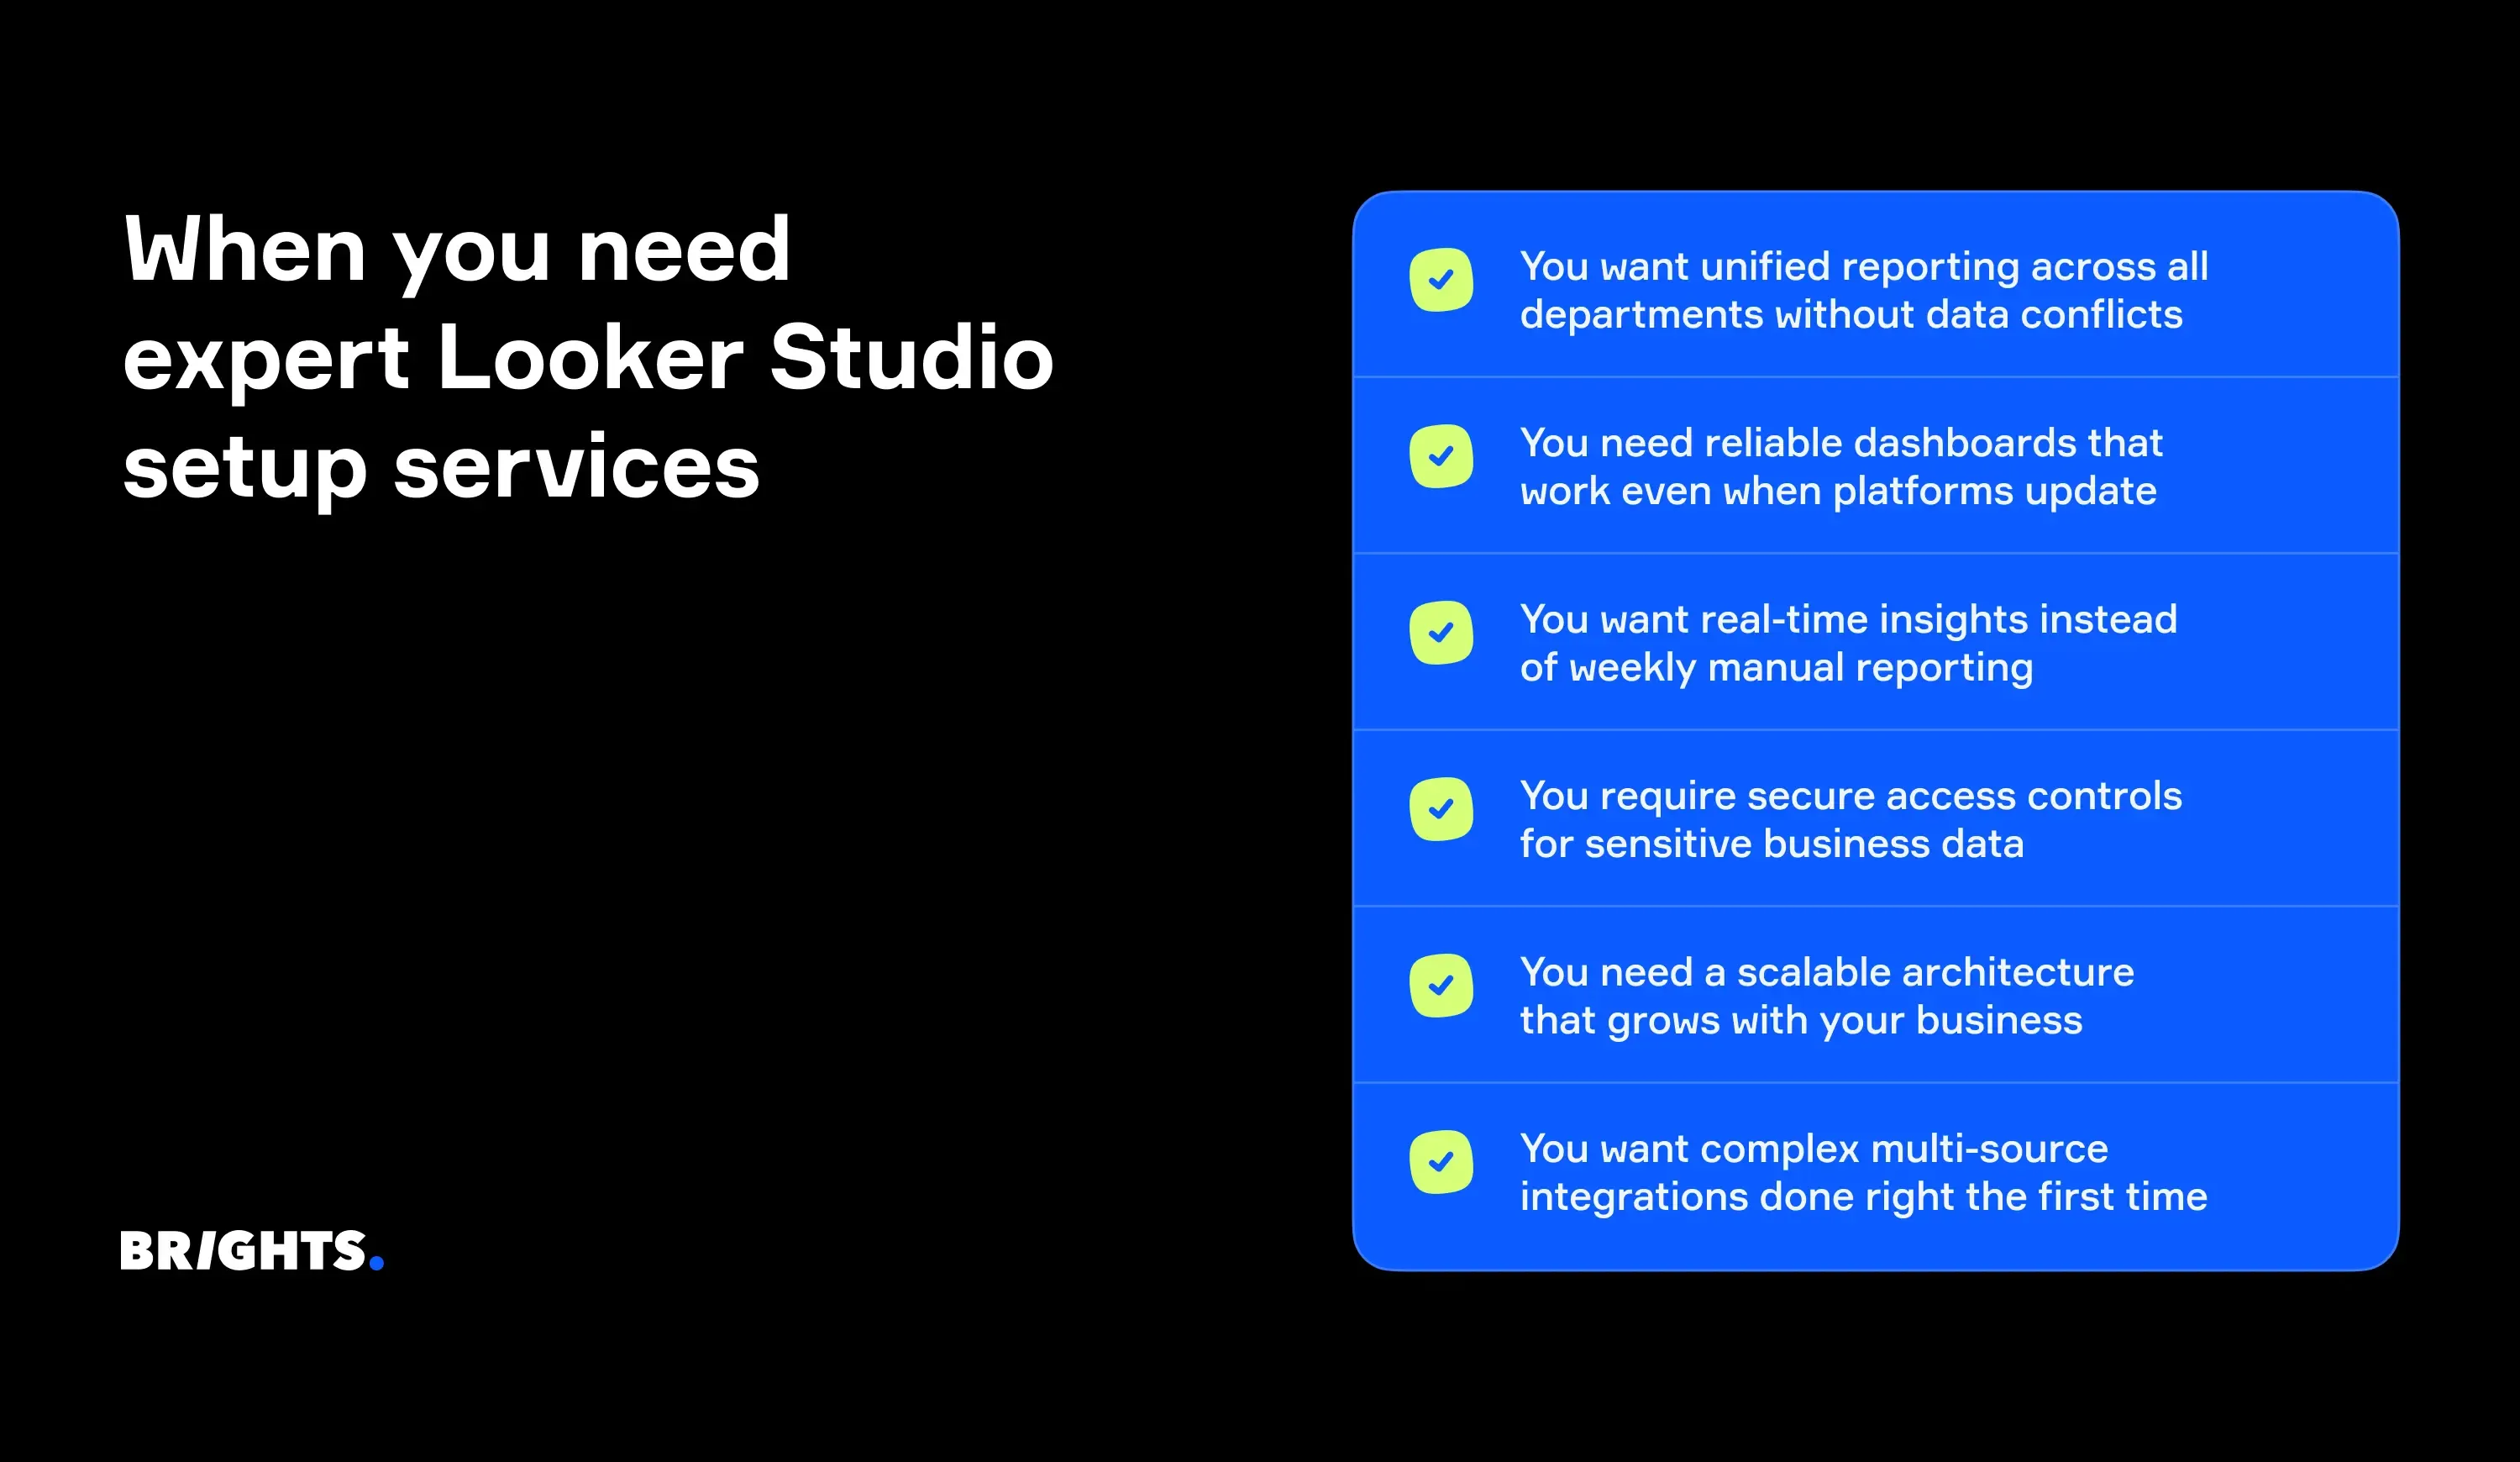
Looker Studio expert integration with a team like Brights also includes proper error handling when APIs change, security configurations that protect sensitive data, and scalability in terms of architecture to handle traffic spikes. Most importantly, expert teams build the foundation correctly and train your internal team to manage updates, add charts, and troubleshoot independently. You get a solid system your team owns and operates, not an ongoing dependency.
Without proper setup, you'll likely face time-consuming data reconciliation, cross-department confusion about metric definitions, and periodic dashboard maintenance when systems update. Getting help early costs less than fixing problems later — and definitely less than making decisions with bad data.
Client spotlight: From manual reporting to real-time dashboards
One of our recent projects shows how these integration principles work in practice — and what happens when everything comes together.
A staffing agency struggled with disconnected marketing and sales data across multiple platforms — Google Ads, LinkedIn, Meta, HubSpot, and Google Search Console. Their marketing team pulled performance data manually whenever executives requested insights, spending hours assembling reports that were outdated by the time they reached decision-makers. The sales team couldn't quickly demonstrate progress to C-level executives, while marketing had no clear view of which campaigns actually drove qualified leads.
“Working with Brights, the agency implemented a comprehensive Looker Studio integration aimed at improving decision-making. Together, we decided to build reports in Looker Studio that served both executive-level overview and detailed marketing analysis needs. The project involved connecting six data sources through custom PostgreSQL connectors after initial third-party solutions proved unreliable for accurate data aggregation.”
— Anastasiia L., Looker Studio expert at Brights
Here are the dashboards we delivered:
Executive summary dashboard: Marketing effectiveness, cost efficiency, and revenue impact for leadership.
PPC performance dashboard: Campaign optimization insights across Google, LinkedIn, and Meta ads.
Lead quality & lifecycle tracking: Progression from first touch to revenue with custom sales stages.
Budget efficiency dashboard: Advertising spend versus revenue with CAC and LTV trending.
The impact became clear immediately, even though the project is ongoing as we are writing this article. What used to take the marketing team hours of manual data collection now happens in seconds through a real-time performance dashboard in Looker Studio. Five team members already rely on the dashboards daily for strategic decisions, and the integration process improved their entire HubSpot system with proper lifecycle stages.
For us, this case study is a perfect demonstration of how data integration creates compound benefits beyond reporting efficiency: better systems, faster decisions, and aligned teams. Looker Studio dashboard examples like these show the practical difference between scattered data and unified business intelligence, outcomes we consistently achieve for companies ready to make the transition.
How to approach data integration in Looker Studio
A clear, business-focused approach makes the difference between dashboards that actually drive decisions and expensive digital wallpaper. Here's a practical four-step framework that works for companies at any stage.
Step 1: Define key business questions first
Ahead of making up your mind about data you think you should track, start with specific questions your leadership team needs answered weekly. Queries like “Which marketing channels drive customers with the highest 12-month retention?” prove more valuable than “Let's track all our marketing data.”
Focus on 3-5 critical decisions that impact revenue, costs, or growth trajectory. Before you build reports in Looker Studio, you need to define what product decisions require data support, be it feature prioritization, user onboarding optimization, or churn prevention.
Step 2: Choose data sources based on those questions
Each business question maps to specific required data sources. Customer lifetime value analysis needs CRM data plus subscription billing, while marketing attribution requires advertising platforms plus conversion tracking.
Understanding how to use Looker Studio effectively means connecting only those sources that answer your priority questions. Cross-channel reporting in Looker Studio typically requires 4 to 6 core connections: GA4 for user behavior, CRM for customer data, advertising platforms for acquisition costs, and financial systems for revenue tracking.
Step 3: Build reliable data pipelines
Once you've identified your data sources, it’s time for technical implementation to connect each system to Looker Studio with consistent formatting and reliable data flow.
GA4 integration captures user acquisition, behavior flow, and conversion events. Configure custom events for product-specific actions like feature adoption or upgrade triggers.
CRM pipelines deliver lead source, deal progression, and customer segmentation data. Ensure lead scoring and sales stage definitions match across teams for accurate reporting.
Advertising data from Google Ads, Facebook, LinkedIn requires consistent UTM tracking. Map ad spend to actual customer acquisition and revenue outcomes.
Stripe and billing systems provide subscription data, churn events, and revenue recognition for accurate unit economics calculations.
Step 4: Configure access and sharing strategically
Smart access controls ensure each team sees the data they need without getting lost in irrelevant metrics. So, we suggest setting role-based permissions so marketing sees campaign performance, finance tracks unit economics, and product teams access user behavior patterns. This approach allows teams to build product dashboard Looker Studio views with filters showing relevant metrics without overwhelming detail. Meanwhile, organizations can create product KPI report Looker Studio templates that automatically populate with current data for weekly reviews.
C-level implementation guidance
Here's what we've learned providing Looker Studio consulting services: resist the urge to build everything at once. Start with one critical business question, prove value with accurate answers, then expand systematically. Once leadership starts making better decisions with real data, expanding to other areas becomes much easier to justify and fund. Plan for about 2–3 weeks to get your first dashboard truly useful, including time for your team to trust the numbers and learn the new workflow.
Conclusion: Turning data into decisions
Looker Studio business intelligence solves the problems your team faces every Monday morning, eliminating debates over which revenue numbers are correct or guessing whether campaigns work. Marketing sees real attribution, finance tracks cash flow in real-time, and product teams access product management KPIs to track without waiting for engineering support.
Data becomes valuable only when it’s unified and accessible, enabling teams to use it for informed decision-making. The companies that succeed with integration commit to changing how they operate rather than adding another analytics tool to their stack.
At Brights, we've seen this pattern repeatedly: once leadership gets reliable, unified reporting, expanding and improving the system becomes much easier to justify. Thus, our goal is to help build systems that teams can rely on for critical decisions, focusing on practical implementation that aligns with how your organization actually operates.
FAQ.
Marketing attribution and customer acquisition cost KPIs typically show improvement within 2–4 weeks, as Looker Studio business intelligence connects campaign data directly to revenue outcomes.

