Automate Reporting with Looker Studio: From Data to Decisions

Every department tracks metrics religiously, and yet actionable insights often remain elusive. Looker Studio report automation can solve this disconnect. But first, let's take a quick look at why so many teams struggle with scattered data.
“A lot of clients come to us with the same problem: they have tons of data but can't work with it effectively because it's scattered everywhere. Marketing teams want to see campaign performance across Google Ads and Meta, but that information is scattered across different tools. Sales teams have CRM data but no clear visibility into what's driving quality leads through their funnel. Product teams launch features with no systematic way to track user interaction. Some information is in Google Sheets, some in GA4, and some in internal systems.
When there's no single source of truth, decision-making gets really complicated. But all these use cases are where our Looker Studio development services come in handy.”
— Anastasiia L., project manager, Looker Studio expert at Brights
The core value of Looker Studio for startups and enterprises is fast, convenient access to analytics that make sense to users. This tool flips this script by connecting everything — Google Analytics, ad platforms, CRM, spreadsheets — into live automated dashboards. At Brights, we've helped many clients make the shift, and this guide will show you how to leverage Looker Studio to connect your data sources, automate reports, and transform how your team makes decisions. Our Looker Studio Consulting expertise ensures that setup and configuration align with business goals.
Key takeaways
When teams spend valuable time compiling reports manually, work with outdated data, and struggle with inconsistent metrics, it makes sense business-wise to automate reporting with Looker Studio.
Looker Studio connects to 800+ data sources through more than 630 connectors, updates automatically and eliminates the need for manual CSV exports and spreadsheet copying.
Real-time dashboards provide marketing teams with timely campaign insights, sales teams with live pipeline tracking, product teams with instant user behavior data, and finance teams — with up-to-date revenue figures.
The tool enables cross-team collaboration with live dashboards, direct chart commenting, and scheduled email updates with proper access permissions.
Implementation should start with understanding specific use cases, KPIs, and metrics to track, as well as establishing standardized reporting formats and assigning ownership over the dashboards.
How manual reporting is secretly sabotaging your business
Consider this: Asana’s 2023 report indicates that people spend roughly 62% of their workday on repetitive, simple tasks, and reporting is part of that large chunk of work. At the same time, almost 60% of American businesses (84% of larger firms) have adopted some form of automation, as per a Duke University study from 2024.
Let's talk about what this actually looks like in practice. Your marketing team gets data from Google Ads, exports a CSV, and then repeats this for Facebook, LinkedIn, and your website analytics. Someone then copies and pastes numbers into a spreadsheet, but by the time it's ready, the data is already outdated. Besides, every department calculates things differently, so meetings often turn into debates about whose conversion rate is right.

Instead of manually pulling data, Looker Studio connects directly to your live data sources and updates automatically, thanks to access to over 800 data sources through 630+ connectors. Basically, this platform handles the process of setting up your data sources and automatically updating visual dashboards. Reports are refreshed automatically, charts are in sync with real-time events, and users access a singular source of truth.
Why Looker Studio beats spreadsheets
The power of Looker Studio lies in eliminating the traditional reporting bottlenecks by connecting directly to your data sources. This means you no longer have to download CSV files, copy metrics into spreadsheets, or update graphs manually. Additionally, one of the major benefits of automating dashboards in Looker Studio is the capability to pull data from Google Ads and GA4 up to Salesforce, HubSpot, and other custom data sources.
Now, let’s get a closer look at the features that put Looker Studio on the list of the best tools for report automation.
| Seamless data integration | Connects to 800+ data sources, including Google Sheets, BigQuery, CRMs, and marketing platforms, thus eliminating manual exports and tool switching. Direct integration means always-current information instead of weekly snapshots. |
|---|---|
| Live dashboards and auto-refresh | Reports update in real time so teams spot problems and opportunities immediately. Perfect for automated reporting for marketing teams since campaigns can be pivoted when performance shifts, and sales can track deal progression throughout the day. |
| Custom visuals for any stakeholder | Executive summaries of operational performance data can be presented as high-level interactive visuals. Teams design reusable dashboard templates that are scalable and adaptable across campaigns, products, or time periods. |
| Interdepartmental collaboration and sharing | Team members can utilize the live dashboard simultaneously with real-time commenting, while pre-configured email notifications keep users informed of scheduled updates. Restricted access permissions ensure that sensitive data is kept confidential. |
| Automated reporting and scheduling | Automated report distribution and scheduling systems generate reports based on selected parameters that update without additional work required from users, distributing them to all relevant stakeholders. Focus shifts from preparation to insights interpretation. |
To better understand the value of Looker Studio, here are some insights into why our clients turn to Brights for implementation support:
“On our end, we go further than just building a dashboard. Our team delves into the client's business, helping to structure their metrics, consolidate all information into a unified format, and prevent confusion. Even a simple metric like conversion can have dozens of different interpretations, so it's essential to get it right from the start.”
— Anastasiia L., project manager, Looker Studio expert at Brights
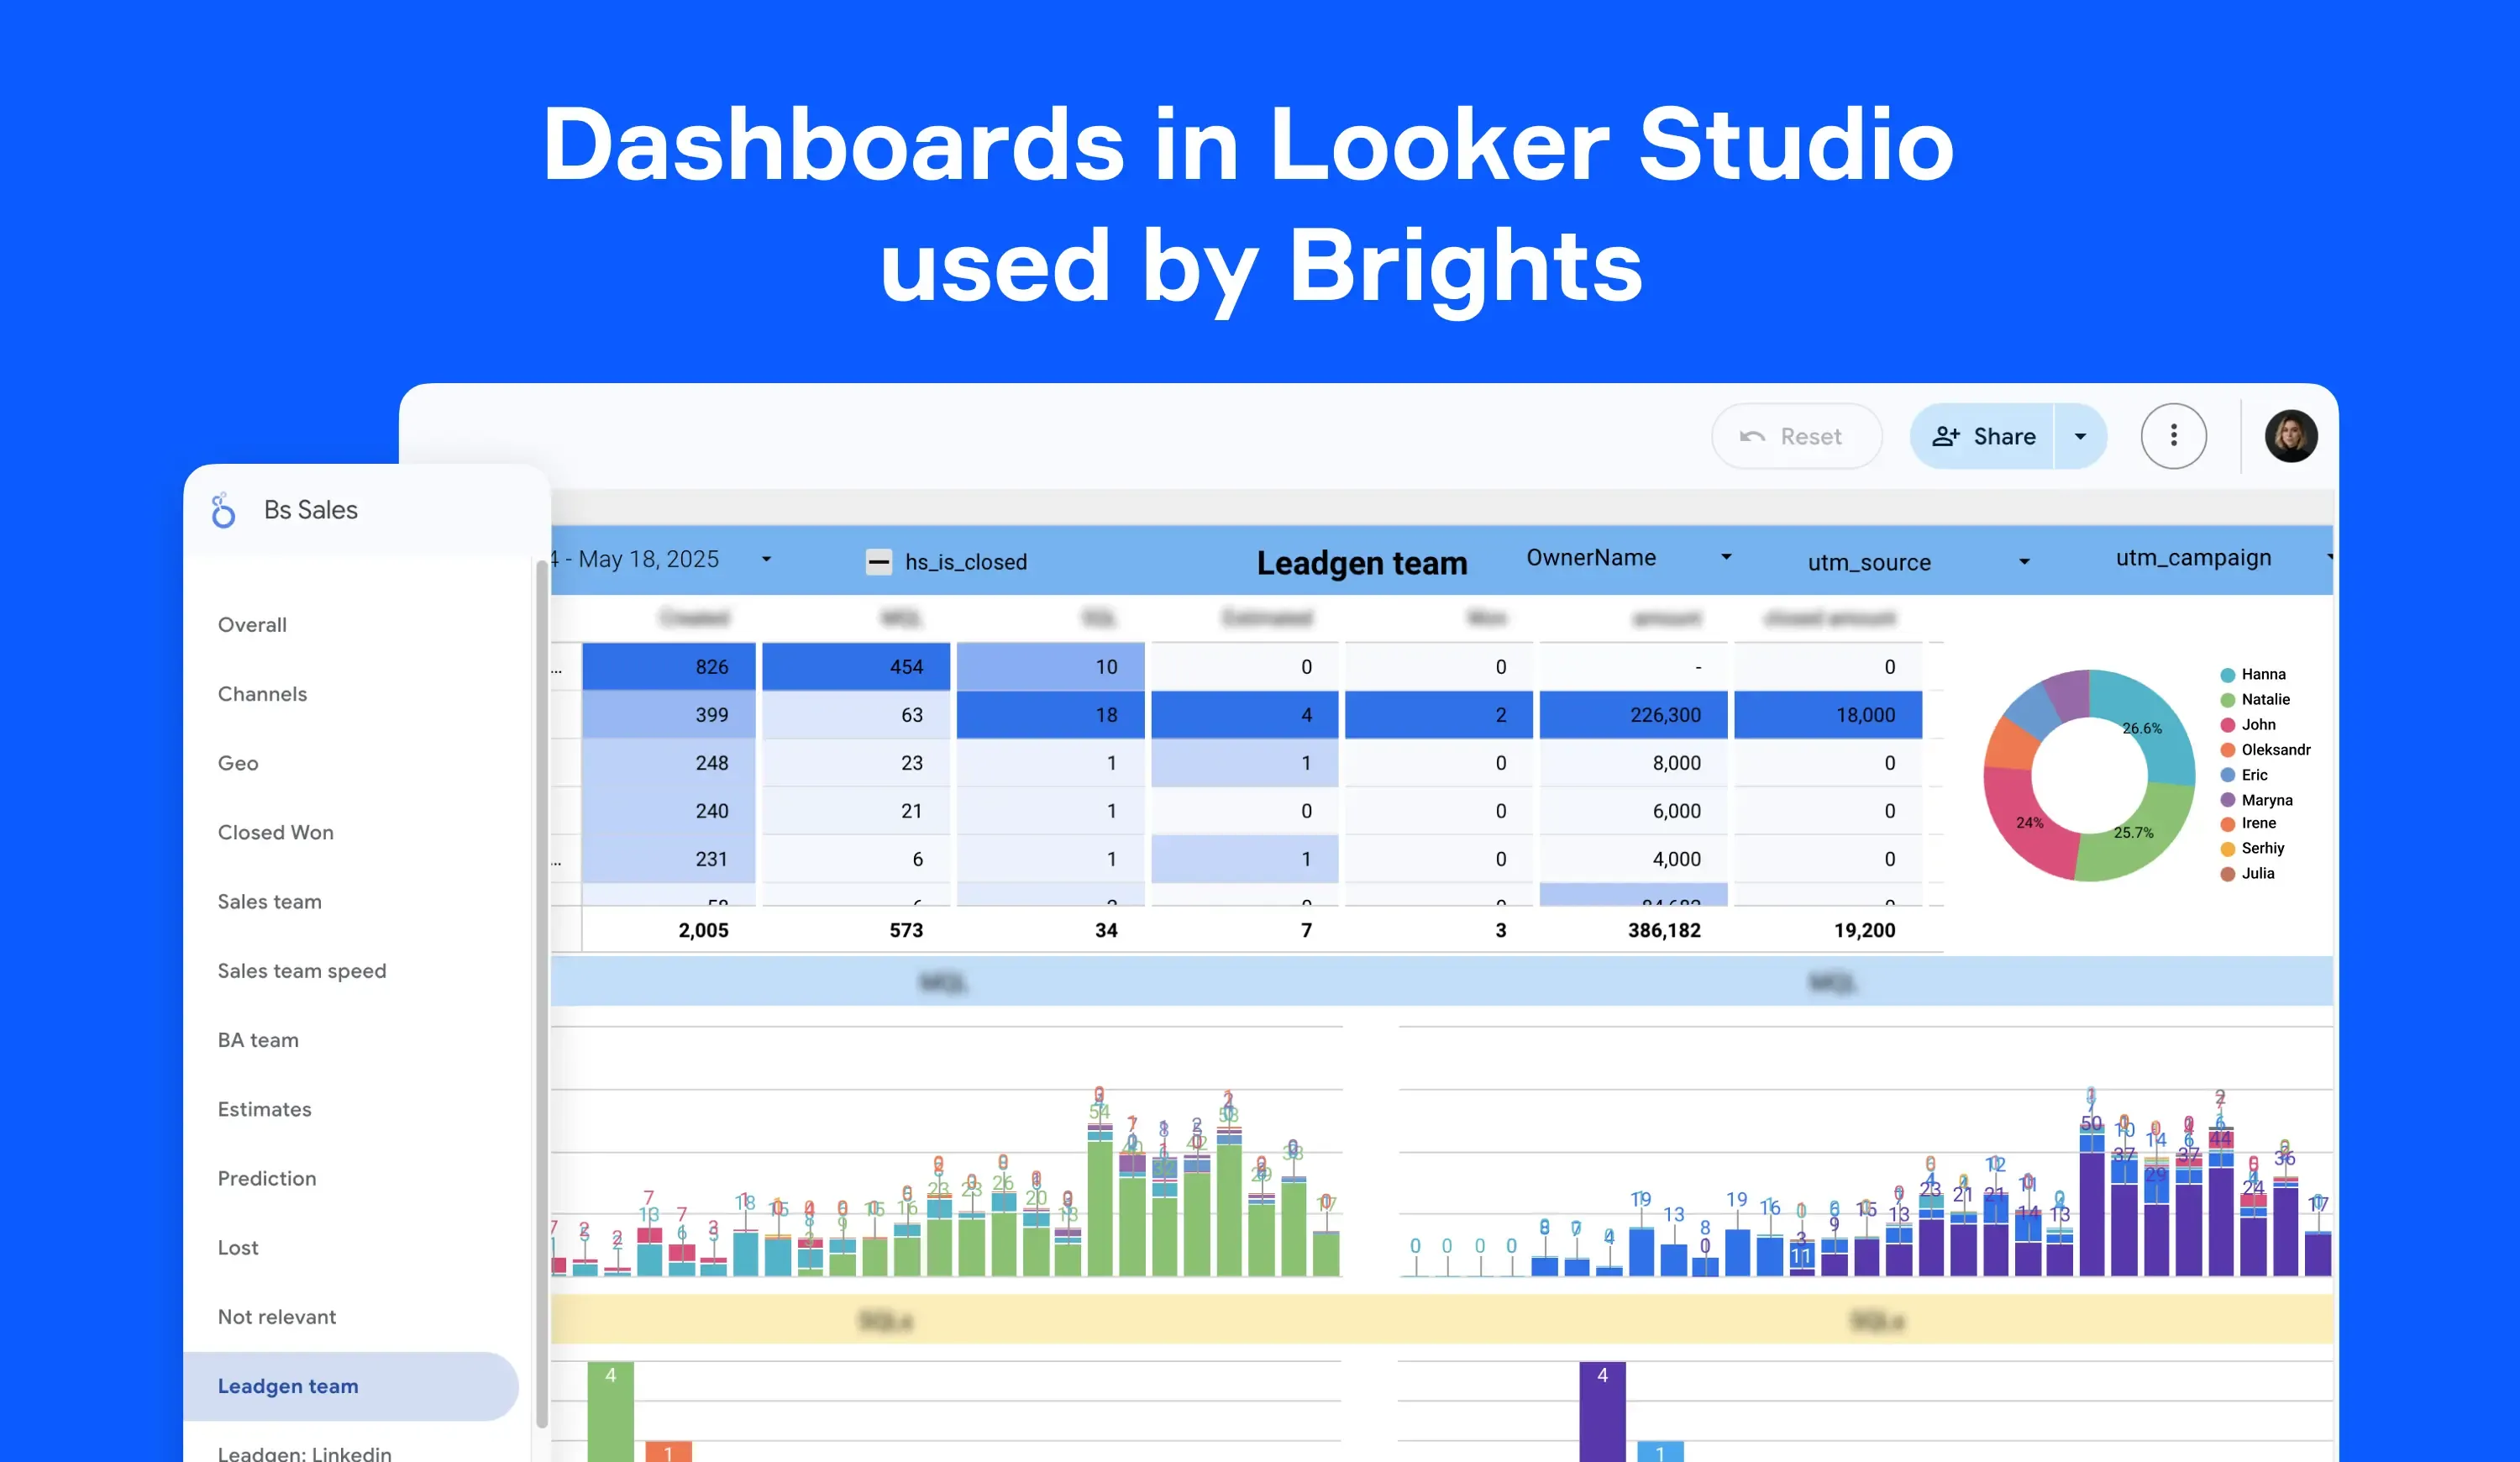
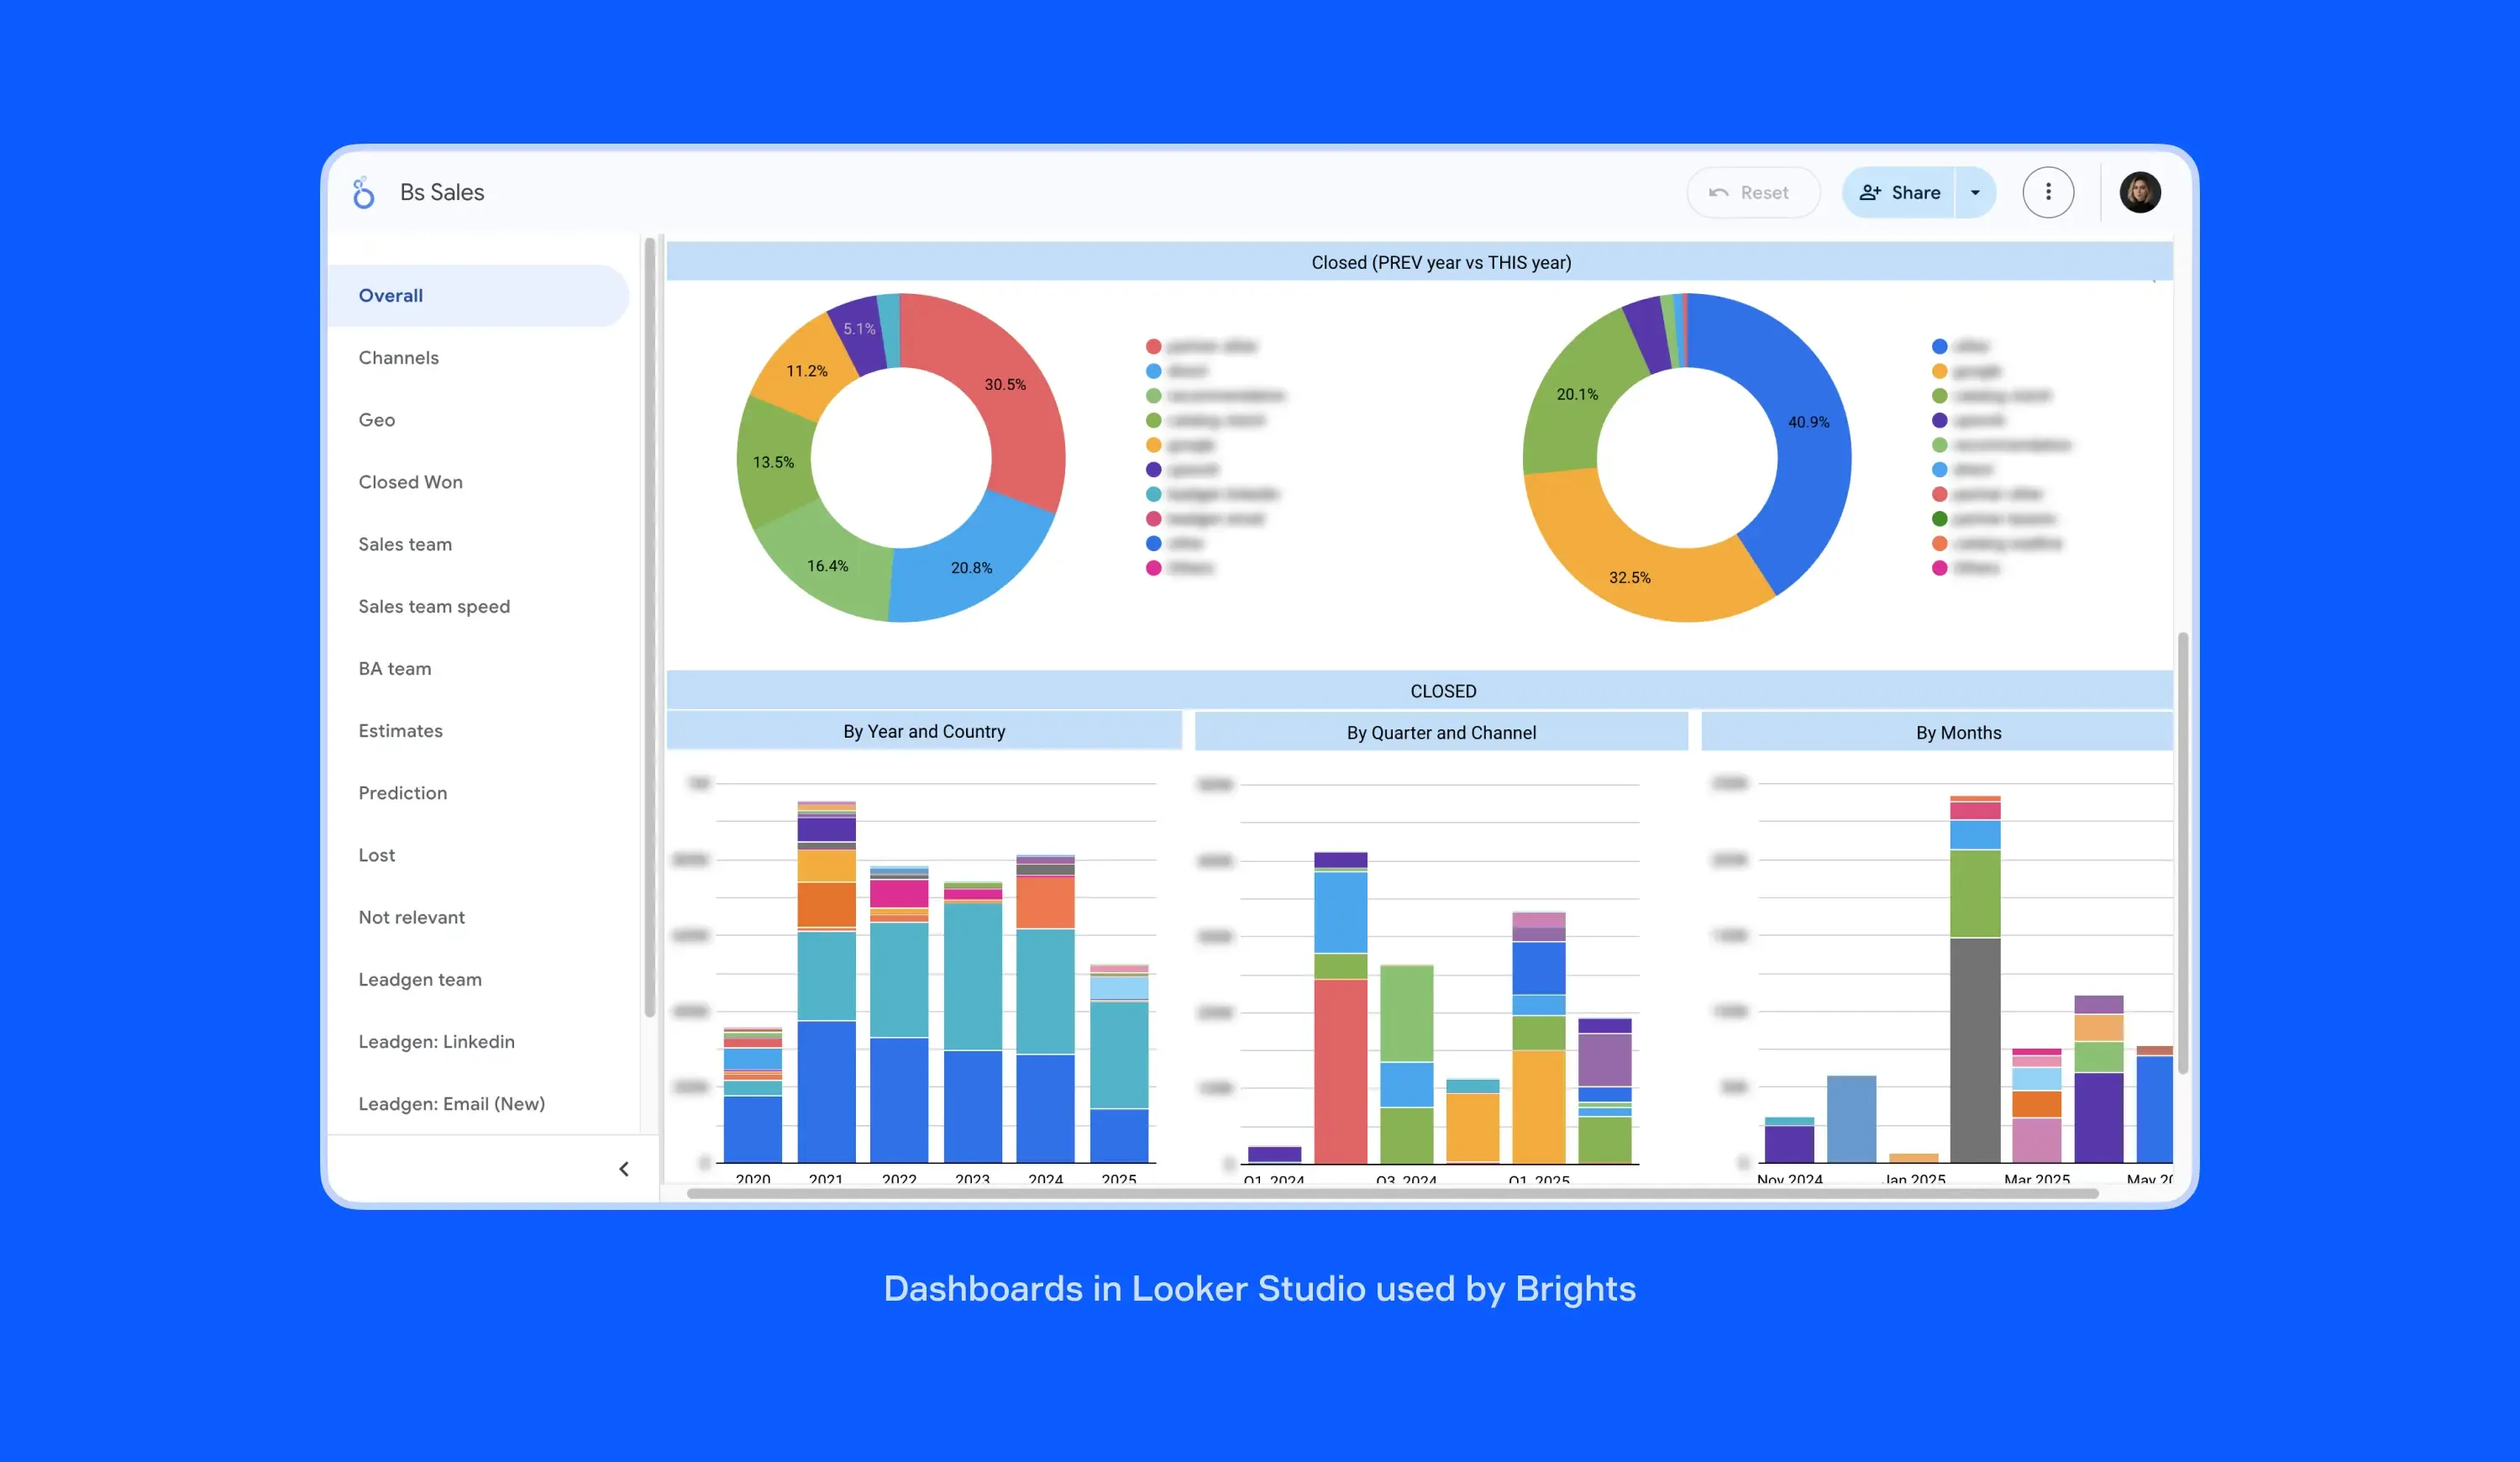
How it works in practice: Brights’ experience
Brights isn’t just building these dashboards for clients. Our team relies on Looker Studio dashboards every day to track our marketing campaigns, monitor sales performance, and make data-driven decisions. We know firsthand what it's like to pivot a campaign using a real-time analytics setup or catch a pipeline issue before it becomes a problem. So, when we talk about the transformation from reactive to proactive reporting, these are the insights drawn from our daily experience with these tools.
Having lived through the switch to a centralized reporting system, we have now become a Looker Studio implementation partner for other teams that want to make that same journey. So, if you need consulting, we are just a few clicks away.
Six critical questions before you adopt Looker Studio
Switching to Looker Studio can be extremely helpful, but you must lay the groundwork. Let’s say your team finally gets the tool set up, creates beautiful dashboards, and everyone's excited for about two weeks. But then, for some reason, people drift back to their old spreadsheets. So, what’s the problem?
The issue isn't that the technology failed — it's that there wasn’t enough preparation to make automation effective. Before diving into sales and marketing dashboard automation with Looker Studio, we recommend taking a step back and working through these six key questions.

What KPIs drive your weekly decisions?
Most teams track dozens of metrics but only act on a handful. Think about your actual workflow and last week's biggest decisions: budget changes, staffing adjustments, campaign tweaks. What data influenced your choices? Those 3-5 core metrics become your dashboard foundation.
Are your data sources ready for automation?
Here's the thing about Looker Studio: it amplifies whatever data quality you currently have. Clean, consistent data transforms into powerful insights, but messy data becomes automated confusion. Address data quality issues before connecting everything to dashboards. This means fixing inconsistent formatting, removing duplicate entries, and making sure everyone follows the same data entry rules.
It’s also important to assess volume and complexity because if you're dealing with massive datasets, we recommend pairing Looker Studio with BigQuery for dashboard performance improvement.
Will your teams embrace standardized reporting?
Yes, this sounds boring. But it's also where many projects fall apart. Successful automation requires shared definitions across departments. For instance, marketing's “qualified lead” needs to match what sales considers qualified. Everyone has to move beyond their personal spreadsheet definitions toward shared standards.
Who will own and maintain the dashboards?
Dashboards need ongoing care. Someone has to handle updates, troubleshoot issues, and train new team members. This also includes managing embedded dashboards for clients if you share performance data externally. Without clear ownership, your dashboards can become outdated, and teams will lose trust in the data.
You have two options here: either give someone on your team the time and training to maintain the dashboards properly, or budget for an outside expert to keep everything running properly.
What's your budget for third-party connectors?
While Looker Studio is free, connecting to non-Google platforms often requires paid connectors. Facebook Ads, HubSpot, and Salesforce integrations can cost $15-50+ per month each. So, you have to do the math on what you actually need before you're surprised by the monthly bill.
Will leadership actively support the transition?
Let’s face it, if people can stick to their old habits (in this case, spreadsheets), many will. Executive support means leaders actively encourage dashboard usage and discourage the “just this once” spreadsheet requests. Without this backing, automation becomes optional, and optional rarely wins.
Before you adopt Looker Studio, take an honest look at where your organization stands on these six points. Yet, keep in mind that if most of your answers reveal gaps, that's not a reason to abandon the project — it's a roadmap for getting ready. Besides, you don't have to figure this out alone. We help our clients work through strategic questions before we touch any technical stuff. Our approach makes sure your Looker Studio setup actually moves the needle for your business.
“One more critical aspect to consider is your actual users. Some people want dead-simple dashboards they can glance through, while others need the flexibility to dig deeper. Looker Studio is fantastic for regular reporting that keeps everyone aligned. However, if your team needs to do complex, on-the-fly analysis, you might hit some walls. But that’s the part we can help you figure out at the beginning of our cooperation.”
— Anastasiia L., project manager, Looker Studio expert at Brights
Last thoughts: Moving beyond manual reporting
If your team is drowning in spreadsheets and constantly copying data around, you're absolutely right to look into reporting workflow optimization options.
Think about it this way: instead of your team spending valuable hours moving numbers, they could be figuring out what those numbers mean for your business. We know this first-hand: companies that switch to data reporting automation tools start making decisions faster and with more confidence. Plus, their teams get to do the interesting work they were hired to do.
When it comes to embracing effective business intelligence with Looker Studio, the tool is definitely a leading contender for reporting automation. Yet here's the thing: it works best when you set it up thoughtfully. To maximize the benefits of Looker Studio, you need to take a step back first, figure out which numbers actually matter, and start small with their cleanest data.
As providers of custom development and Looker Studio development services, Brights has helped numerous companies make this transition. In fact, it's one of our favorite project types because the relief is so immediate. If you're ready to make the shift, we have a proven dashboard development process.
We start by gauging which metrics drive key decisions, alongside refining your data, and then building tailored, modular dashboards aligned with team requirements. Training begins with engaged team members before gradually rolling out to the rest of your organization.
The result is trustworthy data, better collaboration, and faster decision-making with real-time insights you can act on immediately.
FAQ.
The tool natively connects to all Google products. Integrating Google Analytics with Looker Studio is seamless, along with Google Ads, Google Sheets, and BigQuery, without requiring additional connectors. Google Looker Studio integration extends to popular databases such as MySQL, PostgreSQL, and data warehouses. For non-Google platforms like Facebook Ads, HubSpot, or Salesforce, you'll need third-party Looker Studio connectors setup.

