Technical Debt: Definition, Types, and Real Costs for Businesses

Software slowdowns rarely announce themselves. Technical debt showі up as estimates that keep missing, features that take twice as long as planned, and engineering hours spent maintaining systems instead of building on them. By the time the pattern is visible to leadership, it has usually been expensive for months.
For most business leaders, the problem stays frustratingly abstract. You know it is slowing your team down. You suspect it is costing money. But how much, exactly? And is all technical debt the same problem?
It is not. Technical debt accumulates in distinct forms, each with its own symptoms and business consequences. According to McKinsey, technical debt can account for 20–40% of a company's technology estate's total value before depreciation. A CISQ/Synopsys report puts the annual cost of poor software quality in the US at $2.41 trillion, with accumulated tech debt principal at $1.52 trillion.
In this article, we break down what technical debt is, what types your organization is likely accumulating right now, and what it might be costing you.
Key takeaways
Technical debt accumulates in seven distinct forms, each with different symptoms, business consequences, and remediation paths.
Globally, technical debt now represents 61 billion workdays of repair work, per a 2025 CAST Software analysis of over 10 billion lines of code.
2023 McKinsey analysis found tech debt represents approximately 40% of IT balance sheets across large enterprises.
A June 2025 Pega/Savanta survey of 500+ IT decision-makers found that 68% say legacy systems prevent their organizations from fully embracing modern technologies
What is technical debt?
Technical debt is a concept coined by software engineer Ward Cunningham in 1992. The idea borrows directly from finance: taking out a loan lets you move faster today at the cost of paying interest later. In software, shortcuts let you ship faster now, but you pay a compounding cost over time in slower development, more bugs, and higher maintenance overhead.
Think of it like deferred maintenance on a building: skipping the roof inspection saves money today. But when it starts leaking, you're not just paying for the repair — you're paying for the water damage, the structural assessment, and everything that got damaged in between.
Technical debt appears in two ways.
| What it affects | How it shows up | |
|---|---|---|
| Evolvability | How easy it is to build new features on an existing system | Features take disproportionately long. Simple changes require touching too much code |
| Maintainability | How much effort it takes to keep the system running reliably | Slow incident diagnosis. Bugs are hard to isolate. Operational costs grow without clear cause |
Both of these eat directly into your development capacity and budget.
What makes technical debt particularly costly is that it is largely invisible to anyone outside the engineering team. A bug that breaks a visible feature gets noticed. Technical debt accumulates quietly in the structure of the code, the design of the architecture, the gaps in documentation — until the day it can no longer be ignored.
Martin Fowler's Technical Debt Quadrant is a useful framework for understanding that not all debt carries the same risk. It maps debt across two axes: whether it was deliberate or inadvertent, and whether it was prudent or reckless.
| Reckless | Prudent | |
|---|---|---|
| Deliberate | "We don't have time for design." | "We must ship now and deal with the consequences." |
| Inadvertent | "What's layering?" | "Now we know how we should have done it." |
Deliberate and prudent debt is the most manageable form: a conscious trade-off made with full awareness and a plan to address it. The most damaging is reckless and inadvertent debt. Most organizations carry a mix of all four.
Types of technical debt
Technical debt is not a single problem. It accumulates at different layers of a software system, each with its own symptoms, risks, and remediation paths. Here are the seven most common forms.
| Type | Business impact | Typical remedy |
|---|---|---|
| Architectural | Scaling costs, feature bottlenecks | System audit, migration to modular design |
| Code | Slower velocity, harder debugging | Refactoring, linting, code review standards |
| Infrastructure | Risky releases, slow incident response | DevOps practices, observability tooling |
| Testing | Regression risk, slow releases | Automated test suites, QA process overhaul |
| Documentation | Slow onboarding, knowledge silos | Living documentation as part of the dev workflow |
| Security | Breach risk, regulatory exposure | Regular audits, shift-left security model |
| UX/UI design | Lower conversion, higher support costs | Unified design system, shared component library |
Architectural debt
Architectural debt is about the fundamental structure of the system. Tightly coupled components, monolithic architectures that resist scaling, unclear separation of concerns: these are the hallmarks.
The symptoms are hard to miss. Simple features require changes across many parts of the system. The engineering team regularly says "we would need to redesign everything to do that properly." For growing businesses, this is often the most expensive form: scaling becomes unexpectedly costly, and every feature negotiation turns into an architecture discussion.
Addressing it typically requires a formal system audit and a planned migration, often toward microservices or a more modular design.
Code debt
Code debt lives in the source code itself. Long tangled methods, duplicated logic, inconsistent naming conventions, and what developers call "code smells" are the common attributes. It accumulates when code reviews are skipped, style guidelines are not enforced, or teams work under time pressure without refactoring.
The business impact is speed. Code debt makes every feature take longer and every bug harder to trace. Refactoring, restructuring code without changing its behavior, is the standard remedy, alongside automated linting and enforced review standards.
AI coding tools are accelerating this type of debt in ways that are only now becoming measurable. GitClear's 2025 analysis of 211 million lines of code found an eightfold increase in duplicated code blocks in 2024, while refactored lines dropped from 25% of all changes in 2021 to under 10% in 2024. Teams shipping faster with AI assistance may be accumulating code debt faster as well.
Infrastructure debt
Infrastructure debt is about the operating environment: CI/CD pipelines, cloud configurations, deployment processes, and monitoring. When it is high, deployments become risky events rather than routine operations. Incidents take longer to diagnose. Scaling requires manual intervention.
This type is often underestimated because it lives outside the product itself, but it directly affects how quickly and safely you can ship. DevOps practices, including automated pipelines, containerization, and proper observability, are the standard path forward.
Test debt
Test debt builds up when automated testing is skipped, incomplete, or misaligned with actual product behavior. Low coverage, poorly written test cases, and heavy reliance on manual QA all qualify.
The consequence is a fragile codebase where every change carries risk. Engineers become reluctant to refactor because they cannot verify what they have broken. Releases slow down rather than speed up, because each deployment requires manual testing to compensate for missing automation.
Documentation debt
Documentation debt is the gap between how a system works and what is written down about it. Missing architecture docs, outdated API references, and tribal knowledge locked in the heads of specific engineers: all of it qualifies.
This type is invisible until someone leaves, someone new joins, or a compliance audit hits. Developers spend time reverse-engineering logic that should be explained in a README. Onboarding new engineers takes far longer than it should.
The fix requires consistent discipline: maintaining living documentation as part of the development process, not as a task that gets deprioritized under deadline pressure.
Security debt
Security debt accumulates when security measures are deferred: weak authentication, unpatched dependencies, hardcoded credentials, and missing input validation.
This type of debt exposes the business to legal liability, regulatory fines, reputational damage, and the direct cost of a breach. IBM's 2025 Cost of a Data Breach Report — the most recent edition — puts the global average breach cost at $4.44 million. The same report found that 23% of breaches stem from IT failures such as misconfigured or outdated systems.
Addressing it requires regular dependency audits, penetration testing, and a shift-left security model: catching issues earlier in development, not after a release is already in production.
Design debt (UX/UI)
Design debt refers to accumulated shortcuts in the user-facing layer: inconsistent UI patterns, components that were never standardized, or user flows designed for an earlier version of the product that no longer fits.
The business impact shows up in conversion rates, user retention, and support costs. Inconsistent interfaces increase user confusion. As the product grows, adding any new feature requires reconciling it with dozens of slightly different existing patterns. The remedy is a unified design system: a shared library of reusable components and documented standards that all product work builds on.
The real cost of technical debt for modern businesses
Technical debt in software development has a way of feeling manageable until it is not. The costs are distributed and deferred: a little slower here, a few extra hours there, a sprint that runs over budget, a feature that takes three times longer than estimated. None of it looks catastrophic in the moment. The aggregate picture is different.
The numbers
CAST Software's 2025 analysis of over 10 billion lines of code puts global technical debt at 61 billion workdays of repair time. If the world's 25 million software developers stopped building anything new and focused exclusively on paying it down, it would still take nine years.
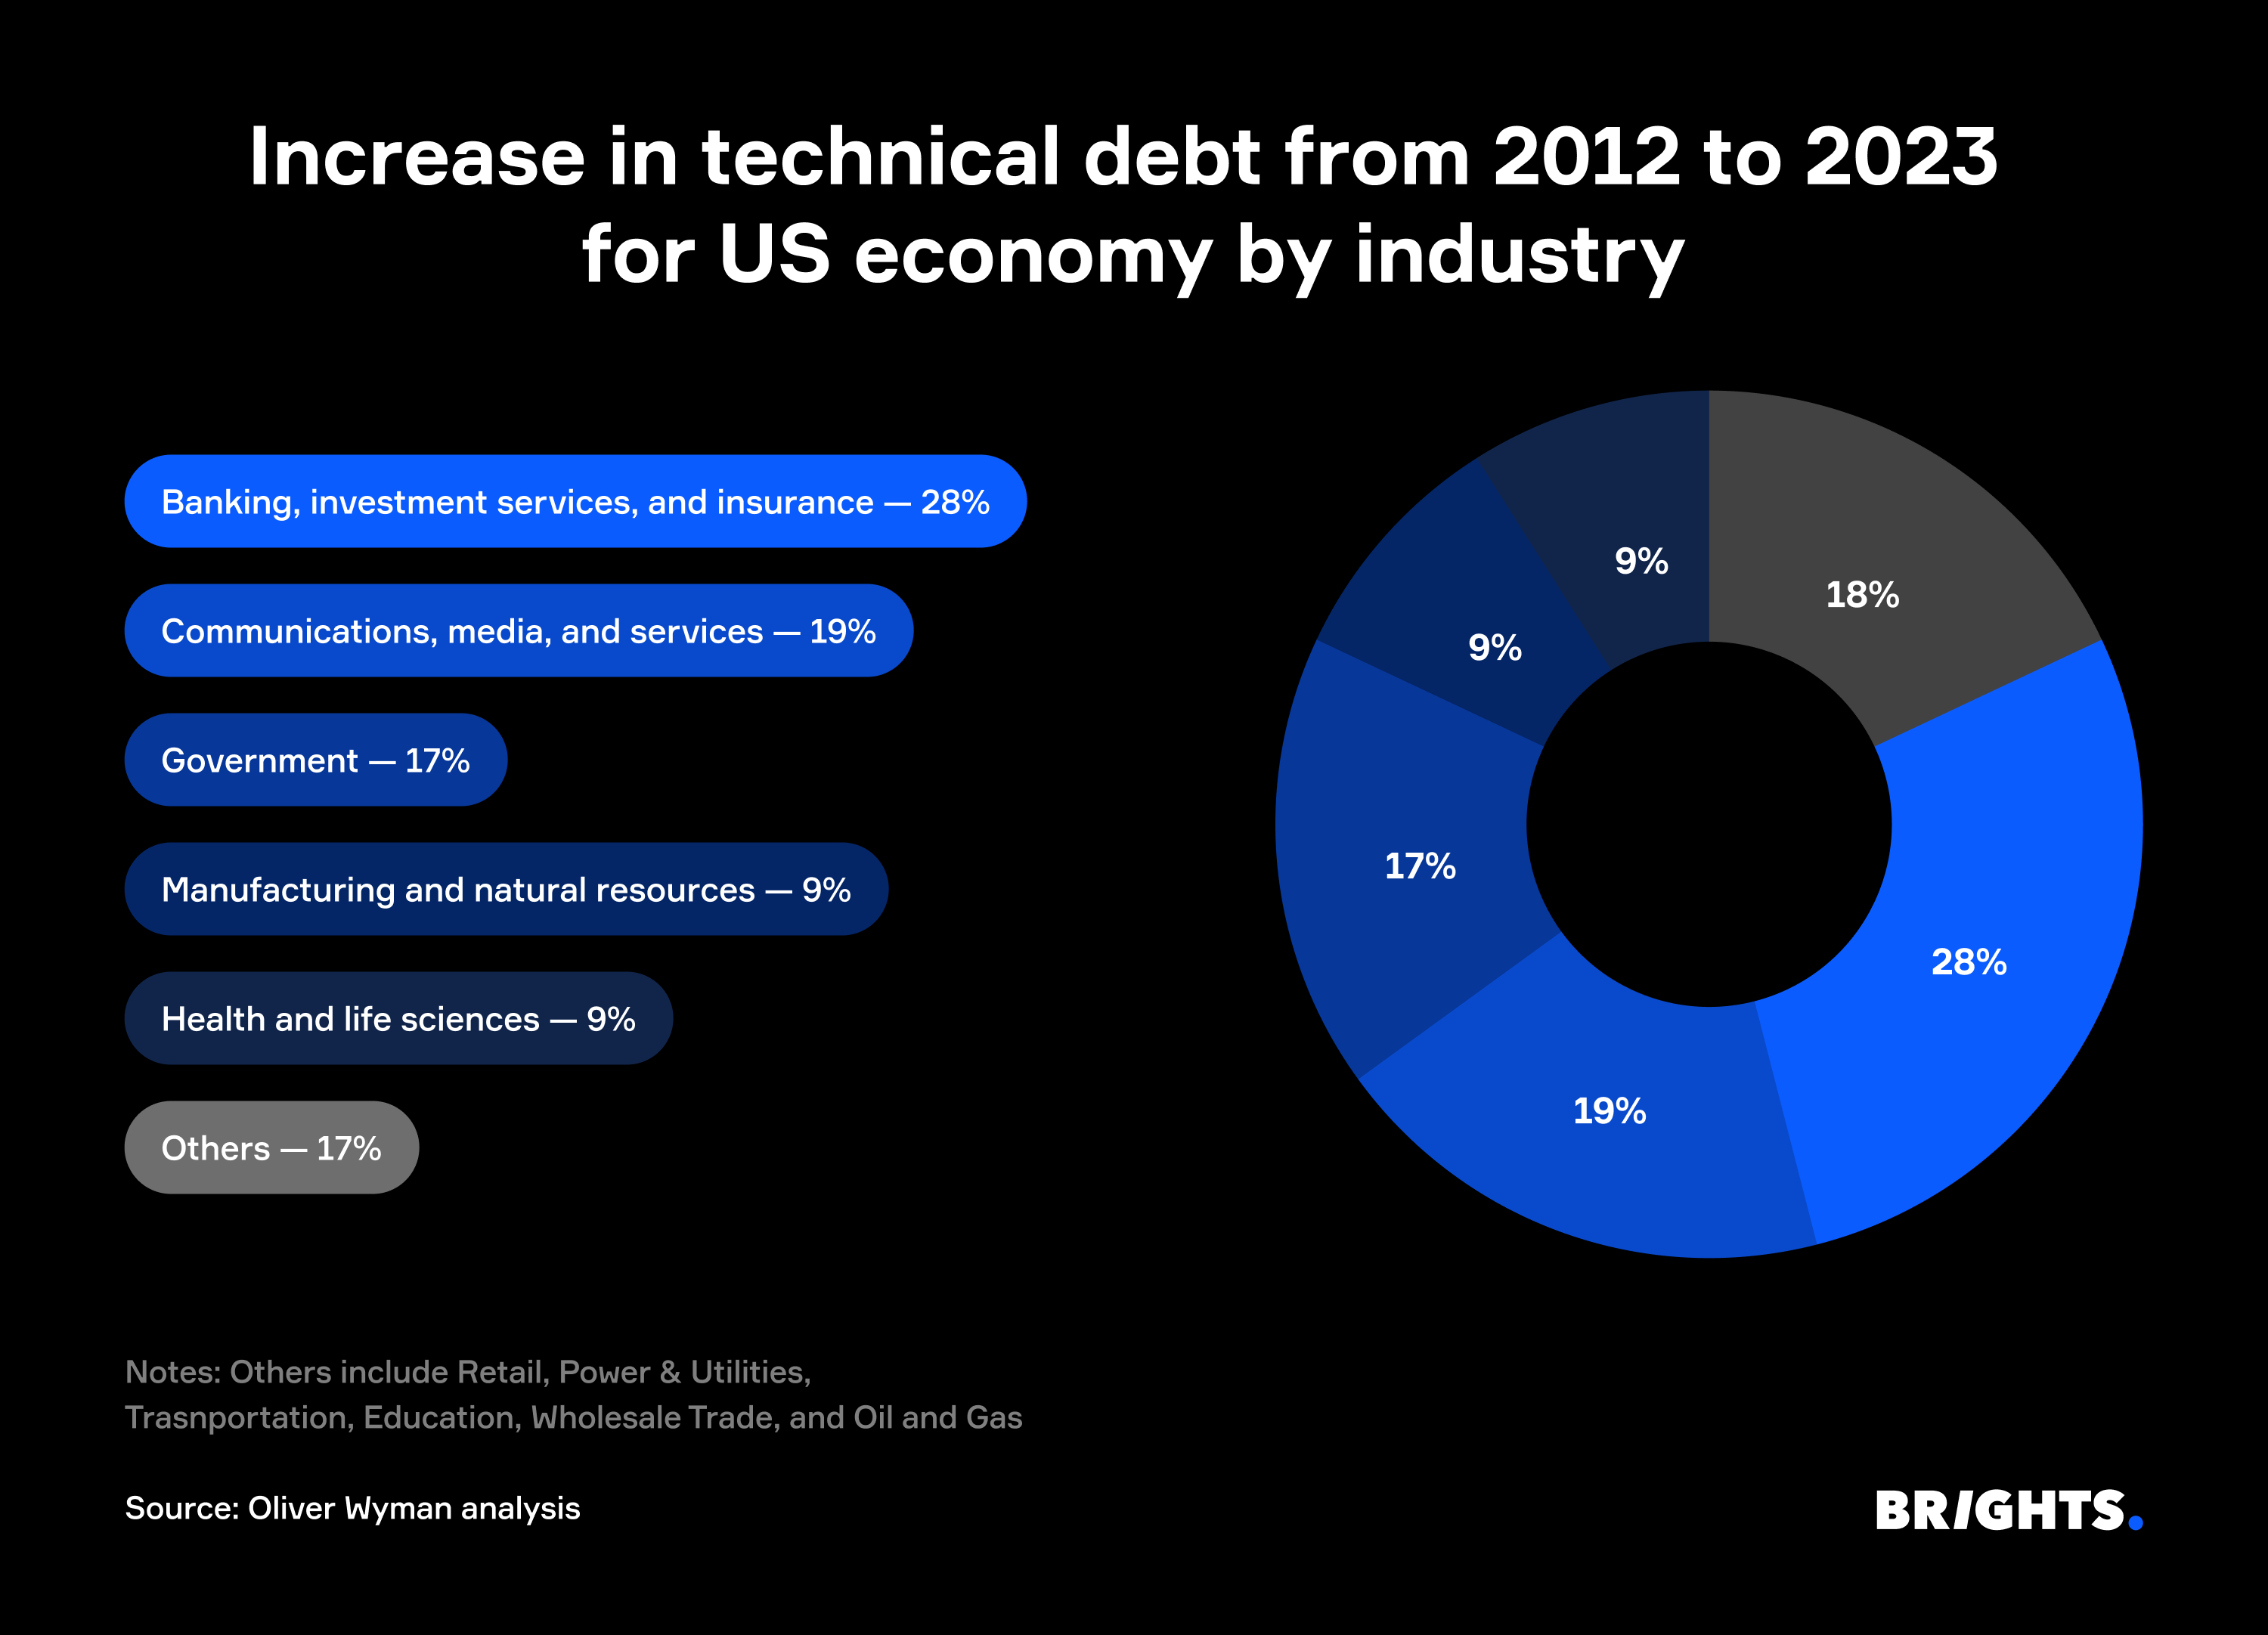
The financial scale is equally striking. A 2024 Oliver Wyman study estimates that global technical debt grew by approximately $6 trillion between 2012 and 2023 — with the US alone accounting for $2.2 trillion of that increase.
At the enterprise level, the average global company wastes more than $370 million per year on technical debt, with roughly $134 million of that attributable to slow, inefficient legacy transformation processes.
The IT budget drain
McKinsey research found that CIOs estimate 10–20% of their budget dedicated to new products gets redirected to resolving technical debt issues. More troubling: 60% of CIOs say their organization's technical debt has risen materially over the past three years.
That gap has a compounding effect. A 2024 Accenture study of 1,500 executives found that leading companies allocate 15% of IT budget to debt remediation — identified as the optimal point before diminishing returns set in. In practice, reactive organizations end up spending 30–40% of their budget on unplanned remediation. The gap between 15% and 40% is where compounding happens.
The productivity tax
Deloitte's Tech Trends 2024 report estimates that developers spend roughly 33% of their time on technical debt maintenance, and that up to 70% of technology leaders view it as the number one cause of productivity loss.
The Stack Overflow 2024 Developer Survey — which polled 65,437 developers across 185 countries — found that 62% rank technical debt as their single biggest workplace frustration, twice the rate of the next-highest pain point.
The business cost shows up in growth metrics. McKinsey's empirical study of 220 companies found that firms in the top quintile of technical debt management grow revenue 20% faster than those in the bottom quintile, and are 40% less likely to experience incomplete or canceled IT modernization programs.
The AI adoption barrier
The competitive advantage from AI tools depends on a reasonably modern, well-structured codebase. Organizations with high technical debt cannot effectively use the tools their competitors are already using. The gap widens with every quarter they wait.
Gartner predicts that over 40% of agentic AI projects will be canceled by end of 2027, with legacy system integration cited as a leading driver. The firm also projects that through 2026, 60% of AI projects unsupported by AI-ready data will be abandoned — a direct consequence of fragmented, debt-laden data infrastructure.
The compounding effect
Technical debt in software development charges interest, and the rate accelerates. A codebase with modest debt might cost 10% extra in development time today. Left unaddressed, new features built on a flawed foundation inherit and amplify existing problems. Each addition costs more. Risk of regressions increases.
Eventually, the system hits what engineers call a tipping point: the cost of continuing to build on the existing foundation exceeds the cost of replacing it. Getting ahead of that tipping point is why technical debt management is increasingly treated as a strategic business decision.
How Brights can help
At Brights, we help businesses understand and address technical debt before it reaches that tipping point. Whether you are dealing with an aging architecture, a fragile test suite, or a legacy codebase that is slowing your team down, we bring the technical depth and process experience to assess the situation clearly and build a practical path forward.
Our engineers have worked across diverse industries and technology stacks. We have seen most forms of technical debt, and we know how to prioritize remediation in a way that balances business continuity with long-term system health.
If your releases are getting slower, your bugs are getting harder to trace, or your team keeps asking for time to "fix things properly," it may be time to take a closer look.
Wrapping up
Technical debt is inevitable. Every software product accumulates it. The question is whether it accumulates deliberately, with a plan to address it, or recklessly, until it becomes a crisis.
In an environment where AI readiness depends on codebase health, where development velocity determines competitive position, and where an unpatched vulnerability carries an average price tag of $4.44 million, technical debt belongs on the executive agenda.
The first step is clarity: what type of debt you have, where it lives, and what it is actually costing your organization. That is where every remediation strategy starts — and where Brights can help.
FAQ.
The clearest signals show up in delivery: features that once took days now take weeks, estimates consistently run over, and engineers keep flagging "foundational work" before new development can begin. At a certain point, what looks like a slow team is actually a slow codebase, and the two require very different solutions.