Data Analytics for Restaurants in 2027 The Full Guide for HoReCa

You increased the prices on your menu two times last year, and cover charges remained the same. Although the quarter ended up thinner than the one before it, no one in the building knows precisely which dish, shift, or channel was responsible for the loss.
The difference between knowing how much revenue a business brings in and knowing its margin is the main operational problem in the hospitality industry at present. According to the National Restaurant Association's 2026 State of the Restaurant Industry report, 42% of operators stated that their restaurants were unprofitable in 2025, which is an increase from the 29% who said so in 2024, and 60% of them said that business conditions had worsened during the year, even though sales had increased.
Restaurant data analytics involves taking the transactional records that a venue already generates, such as those from the point of sale, reservations, purchasing, scheduling, delivery platforms, and guest profiles, and combining them into one unified model that can be queried, after which the model is used to forecast demand, set prices for dishes, plan staff shifts, and place orders for stock. It is essentially an engineering challenge before it can be regarded as an analytics problem, since in most restaurants, those records are stored in five or six different systems that were never intended to communicate with one another.
The guide discusses the true source of value, the criteria for what to measure, the dashboards used, how to decide whether to buy a platform or build one yourself, and the steps you should take to make the most of the data you already have.
Why 2026 looks different from 2024
Two changes took place, and they add up.
The first is AI adoption speed. Restaurant365's 2026 State of the Restaurant Industry: Mid-Year Report, based on responses from more than 420 operators representing nearly 10,000 US locations, found that the share of operators using AI for back-office reporting and analytics rose from roughly 25% at the start of 2026 to 69% actively using or piloting it by mid-year. Six months, a near three-fold increase.
The second is that the returns on AI adoption are now measurable. In the same study, among operators actively using AI, 62% reported lower labor costs and 61% reported lower food costs, with roughly a third reporting reductions of 6% or more. Eighty-eight percent said the technology saves them time every week. Restaurant365 calls the widening distance between adopters and non-adopters the Restaurant Profitability Gap, and on a business running a 3% to 5% net margin, a 6% cut to the two largest cost lines is the difference between a loss and a live business.
There is a reason why adoption takes place in the back office. According to the NRA's 2026 report, just 6% of operators use AI in connection with a customer order, whereas marketing and administrative tasks lead the way. Since forecasting, scheduling, and inventory management have a direct impact on the bottom line and involve much less guest experience risk, they are the ones that are most widely used.
How restaurant data analytics adds value to your business
The worth of it lies in the delay. Since a restaurant's profit and loss statement is closed two to four weeks after the month it covers, any portion issue that begins on the 3rd won't be spotted until the 25th and will have already been paid for 22 times. The value of analytics is determined by the extent to which it reduces that gap—transforming a monthly report which deals with the past into a daily figure that can be used to update tonight's prep list and next week's rosters. Each week that you reduce the gap is a week during which the same error continues to be funded.
It is the nature of a narrow margin that makes that level of compression so valuable. Full-service restaurants generally achieve a net profit margin of between 3% and 5%, and food and labour together make up about 70% of sales. If you reduce the combined cost base by one percentage point, that is equivalent to moving one percentage point of sales directly to the bottom line; on a 4% margin, this represents a quarter of the annual profit. According to Restaurant365's 2026 mid-year research, 62% of operators who were using AI reported lower labour costs and 61% reported lower food costs, with about one third of them saying the reductions were 6% or more. Given how slim the margins are, a reduction of that magnitude determines the outcome of the year.
Where that value shows up in practice:
Cost you can see while you can still act on it. Theoretical-versus-actual food cost read weekly catches a portioning or receiving problem inside seven days instead of at month-end close.
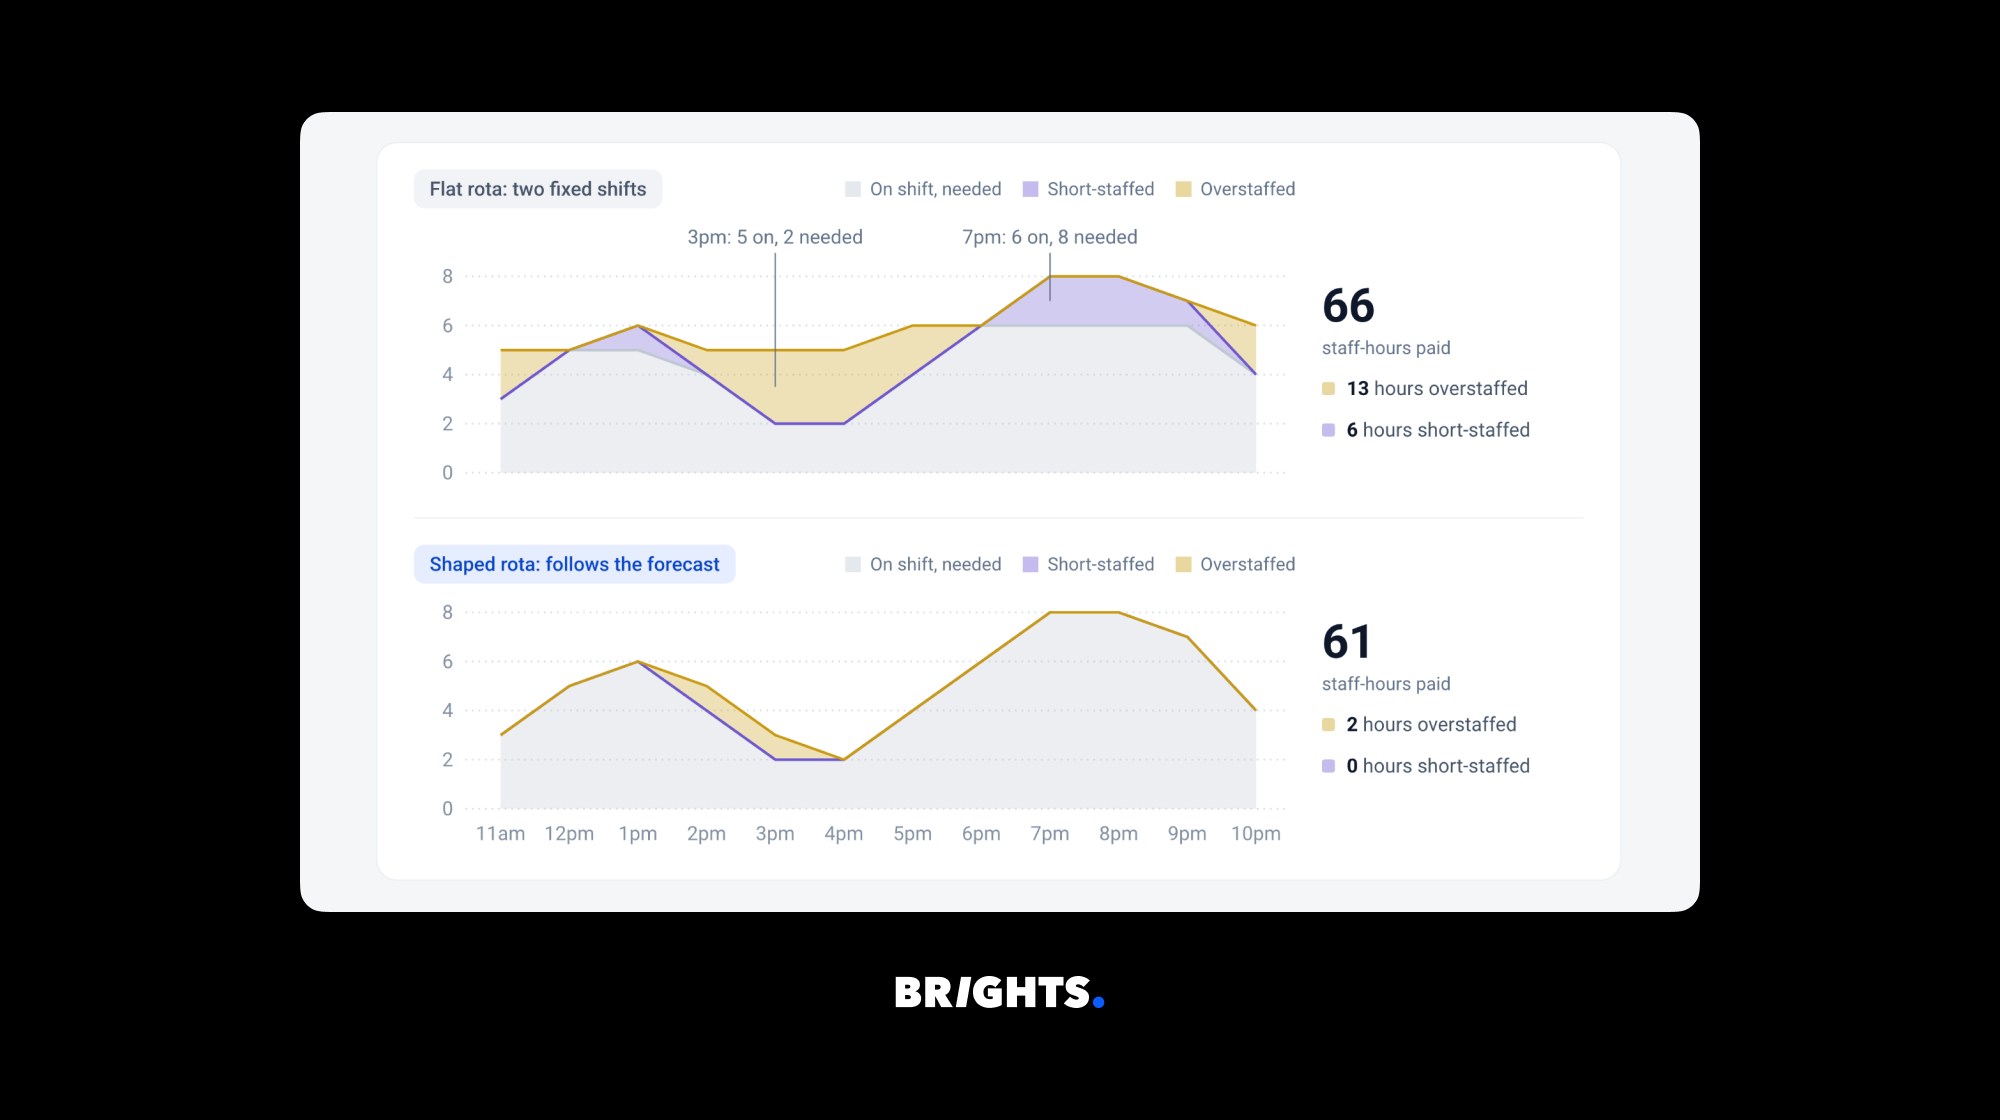
Labor is shaped by hour rather than by headcount. Sales per labor hour by day-part shows where a shift is overstaffed at 3 p.m. and short at 7 p.m., which a weekly labor percentage hides completely.
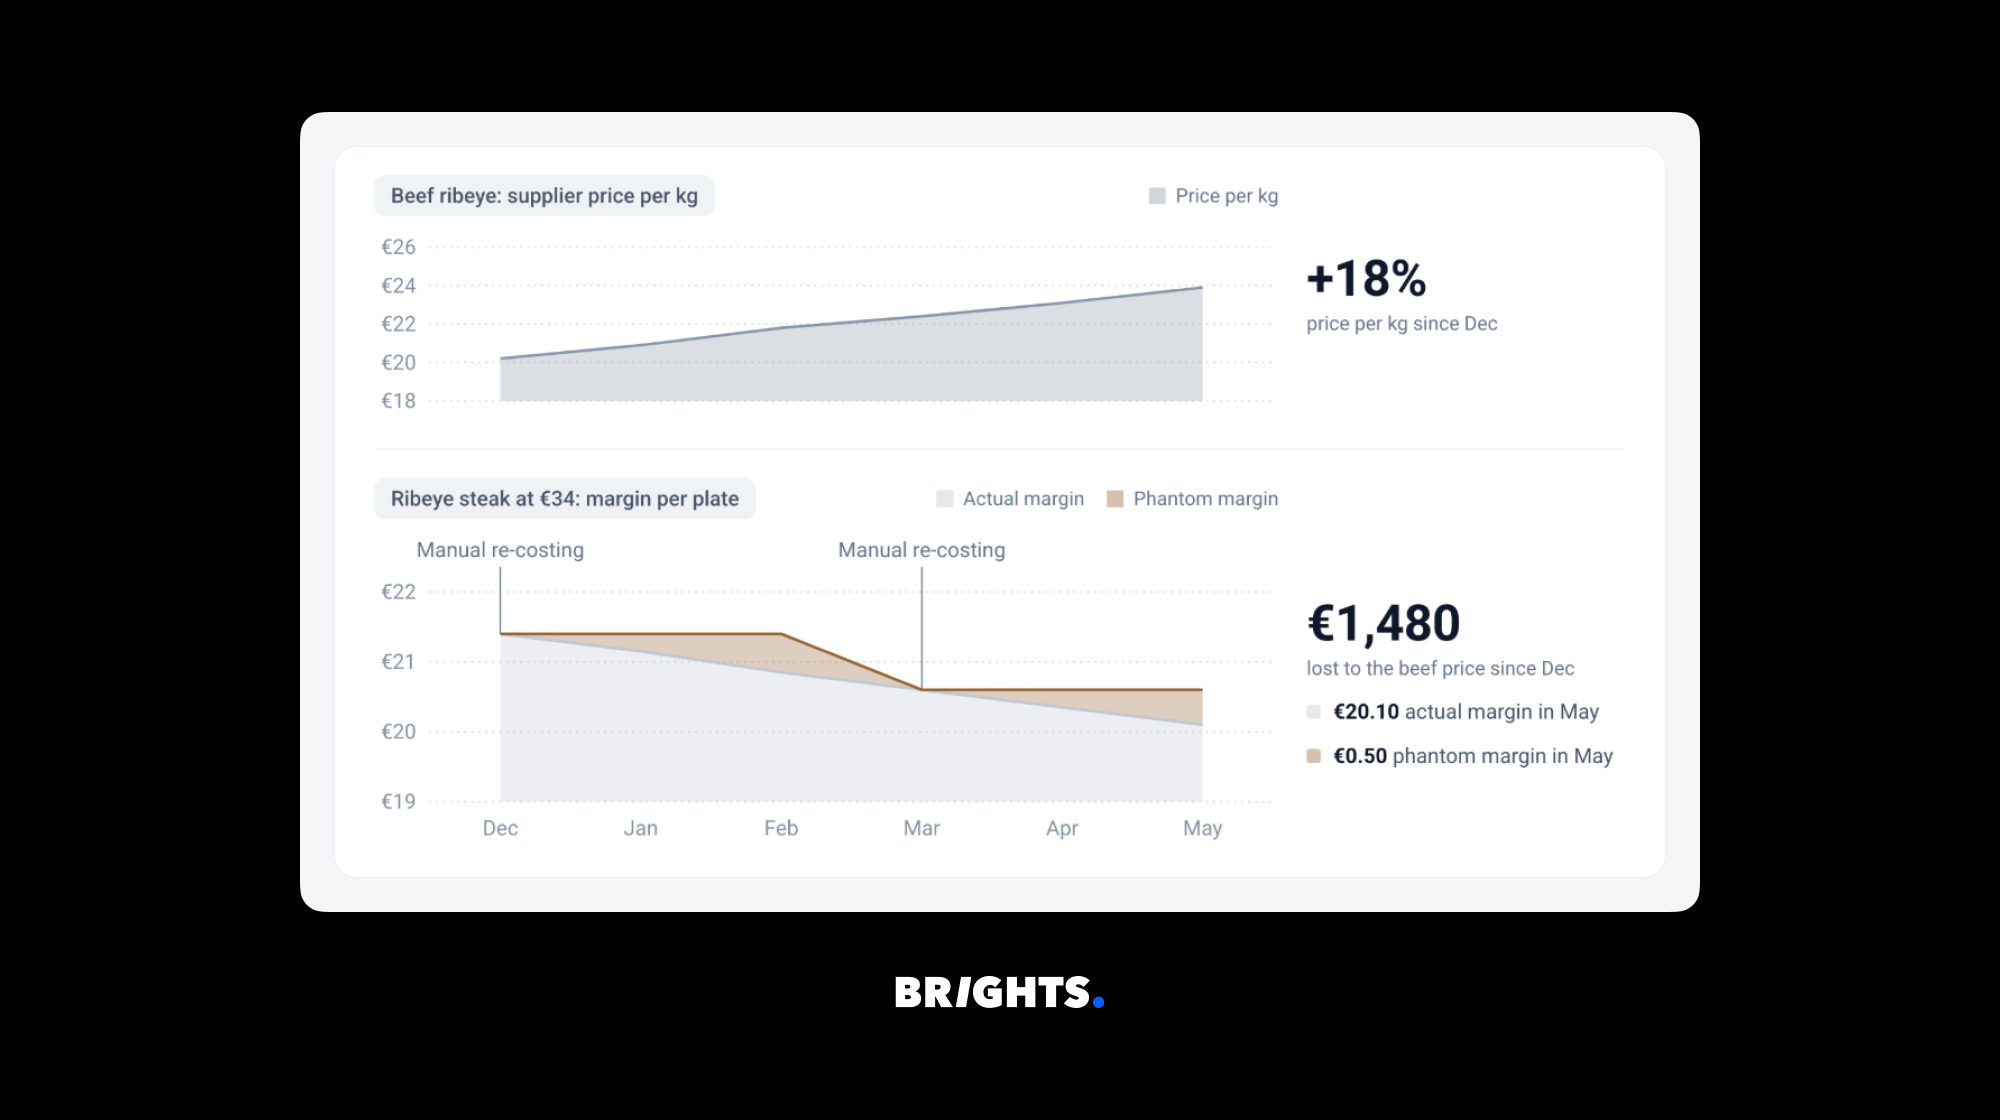
Prices and portions argued from contribution margin. Recipe costs refreshed automatically from invoice data keep menu decisions current when protein and produce prices move mid-quarter.
Guests you keep because you noticed them leaving. A 90-day repeat visit rate flags a lapsing regular while a marketing spend can still bring them back.
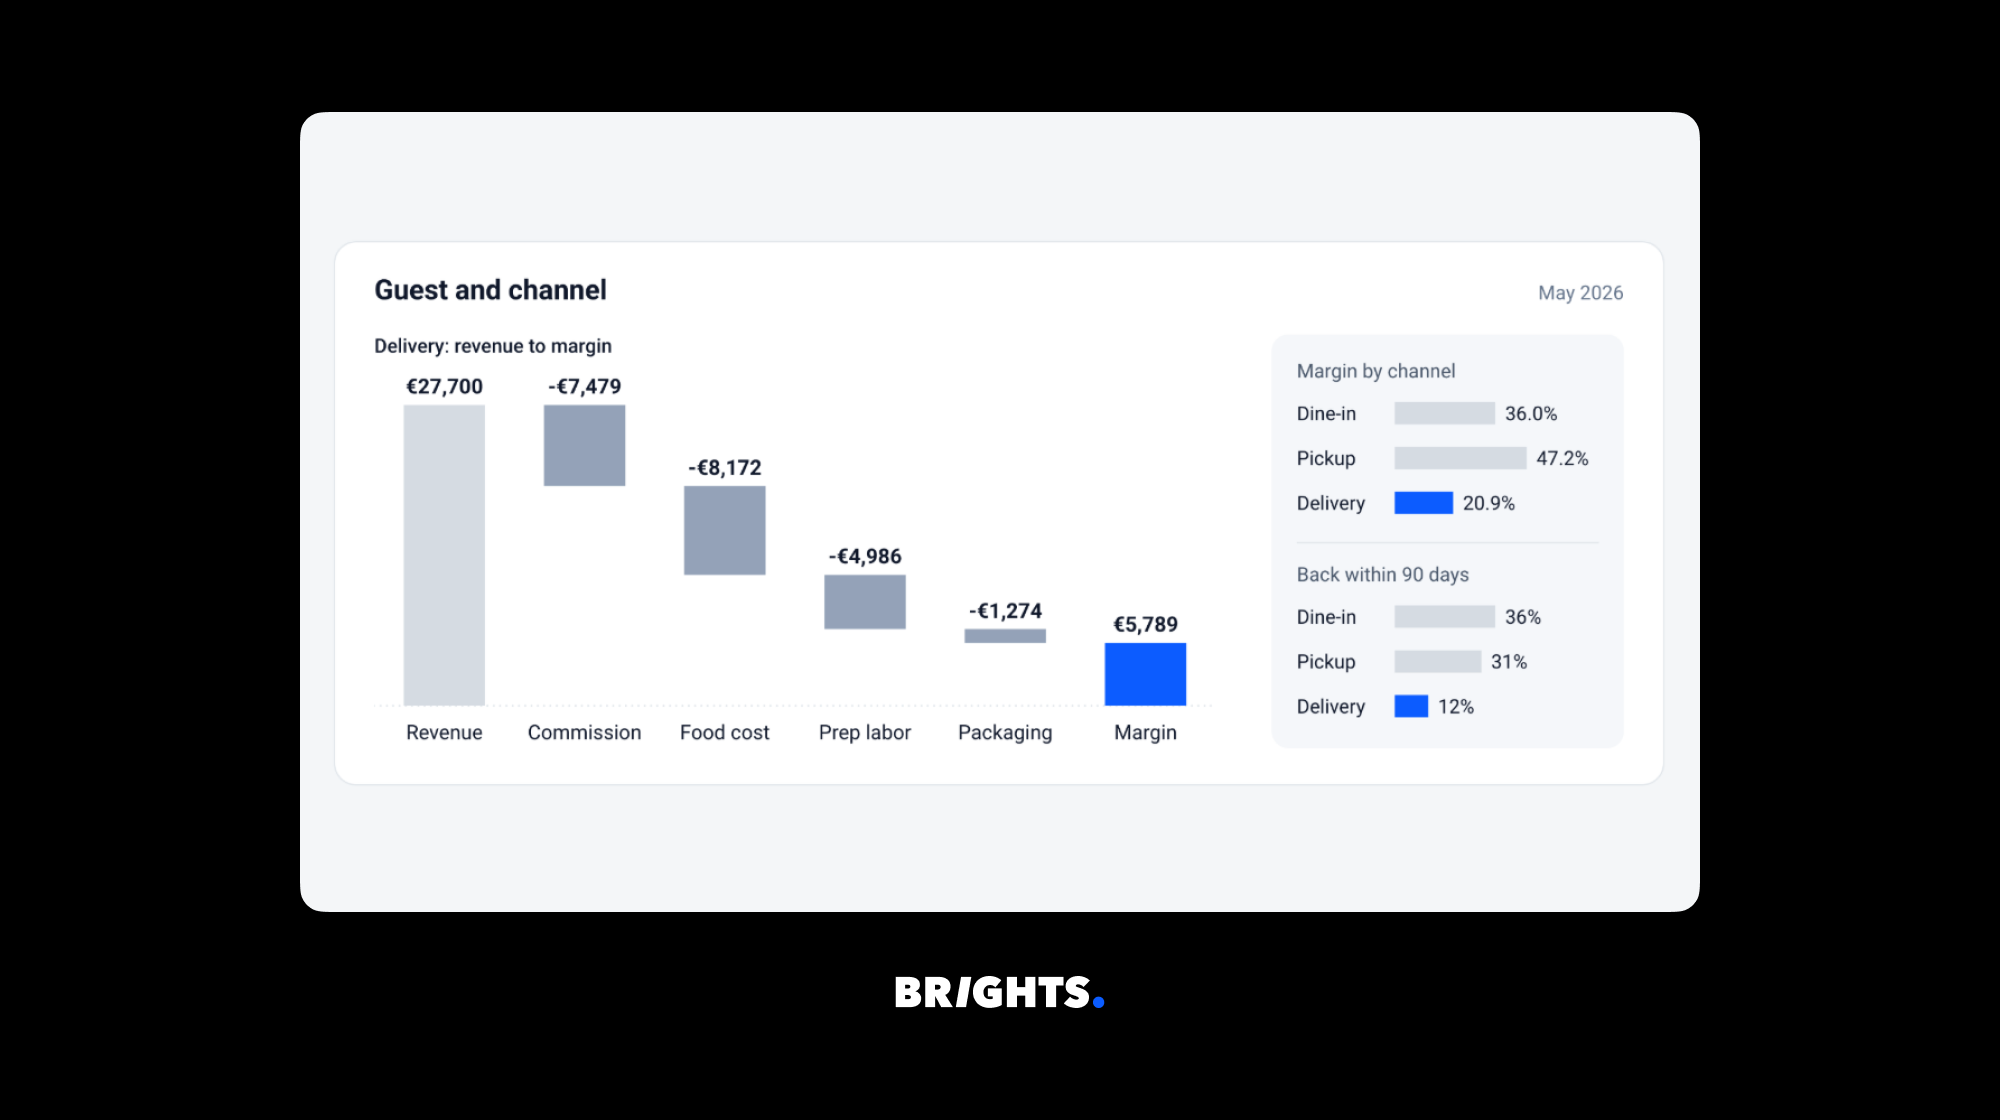
Channels cost honestly. Allocating commission, packaging, and prep labor back to delivery tells you which platforms earn their place and which ones are buying you revenue at a loss.
There is another reason why returns compound in the hospitality industry: decisions are made over and over again. A venue forecasts demand, orders stock, and prepares its roster hundreds of times each year, and a model which is 8% more accurate uses that improvement in each of those instances. It is due to this kind of repetition that the back office has gotten ahead of guest-facing AI in terms of adoption. While a voice bot only affects one interaction, a better forecast has an impact on every shift for the rest of the year.
The improved position it gives you over and above the P&L is one of greater negotiating power. If an operator gives a supplier twelve months' worth of weekly item-level volume or provides a landlord with a defensible cover forecast, they are relying on evidence rather than on memory. This sort of advantage is not displayed on any dashboard and is usually the first point that operators mention when they have it.
What data does a restaurant already own?
Most operators assume an analytics project starts with buying something. It starts with an inventory of what already exists.
| Source system | What it holds | Typical access |
|---|---|---|
| POS | Item-level sales, timestamps, covers, discounts, voids, server ID | API or nightly export |
| Reservation / booking platform | Party size, lead time, no-shows, cancellations, table turn | API, often rate-limited |
| Purchasing and inventory | Invoices, unit costs, supplier terms, stock counts | CSV or supplier portal |
| Scheduling and payroll | Hours, roles, wage rates, overtime | API |
| Delivery aggregators | Orders, commissions, prep and delivery times, refunds | Partner API per platform |
| Loyalty / CRM | Guest identity, visit frequency, dietary preferences, spend | API |
| Reviews and search | Google ratings, review text, local search impressions | Google Business Profile API |
In 2026+ it is worth looking at two of them in more detail.Reservation data is the least exploited resource in the full-service hospitality industry, since lead time, the distribution of party sizes, and the no-show rate according to the time of day are better at predicting prep volume than last year's sales alone, as they reflect demand before it arrives rather than after the fact. Brights provides booking platforms for customers whose own guests book tables, rooms, or time slots, and in such cases the reservation record is generally the clearest and best-structured data in the entire dataset.
More importance should be attached to reviewing and searching data than its reputation indicates. According to the mid-year survey carried out by Restaurant365, operators stated that Google Reviews and Search were the channels that generated the most customer engagement and traffic, at 27.5%, beating loyalty programs at 19.1% and Instagram at 18.3%.
Which metrics actually change decisions?
A metric that reports what happened is a rear-view mirror. The ones below were chosen because each has an action attached.
| Metric | Definition | Source | Cadence | Decision it drives |
|---|---|---|---|---|
| Theoretical vs actual food cost | Recipe-costed usage against counted usage | POS + inventory | Weekly | Where stock is leaking |
| Contribution margin per item | Menu price minus true recipe cost | POS + purchasing | Monthly | Menu engineering, delisting |
| Sales per labor hour | Net sales divided by hours worked | POS + scheduling | Daily by day-part | Shift shape, not headcount |
| Forecast accuracy (MAPE) | Mean absolute percentage error on covers | Forecast + POS | Weekly | Whether to trust the model |
| No-show and cancellation rate | Share of booked covers that never seat | Booking platform | Weekly by day-part | Overbooking policy, deposits |
| Channel-level net margin | Revenue minus food cost, commission, packaging and the labor that channel uses | POS + aggregators | Monthly | Which channels to keep |
| Repeat visit rate at 90 days | Share of identified guests returning within 90 days | Loyalty / CRM | Monthly | Retention spend allocation |
The accuracy of forecasts should be given its own line; frequently, teams omit it, which is one reason why the kitchen stops trusting the prep sheet. A forecasting model only gains the right to influence decisions when its error rate is published every week.
The importance of channel-level net margin increases every year. According to the Restaurant365 mid-year data, the proportion of operators taking 0% to 10% of revenue from third-party delivery has fallen from 62% at the beginning of 2026 to 47% currently — indicating that delivery now makes up a bigger part of the business for a greater number of restaurants than it did six months ago. Since commissions, packaging, and the kitchen labor involved in a delivery order are rarely passed back to the channel, the channel appears more profitable than it actually is.
How do restaurants use analytics to cut costs?
Demand forecasting and prep planning
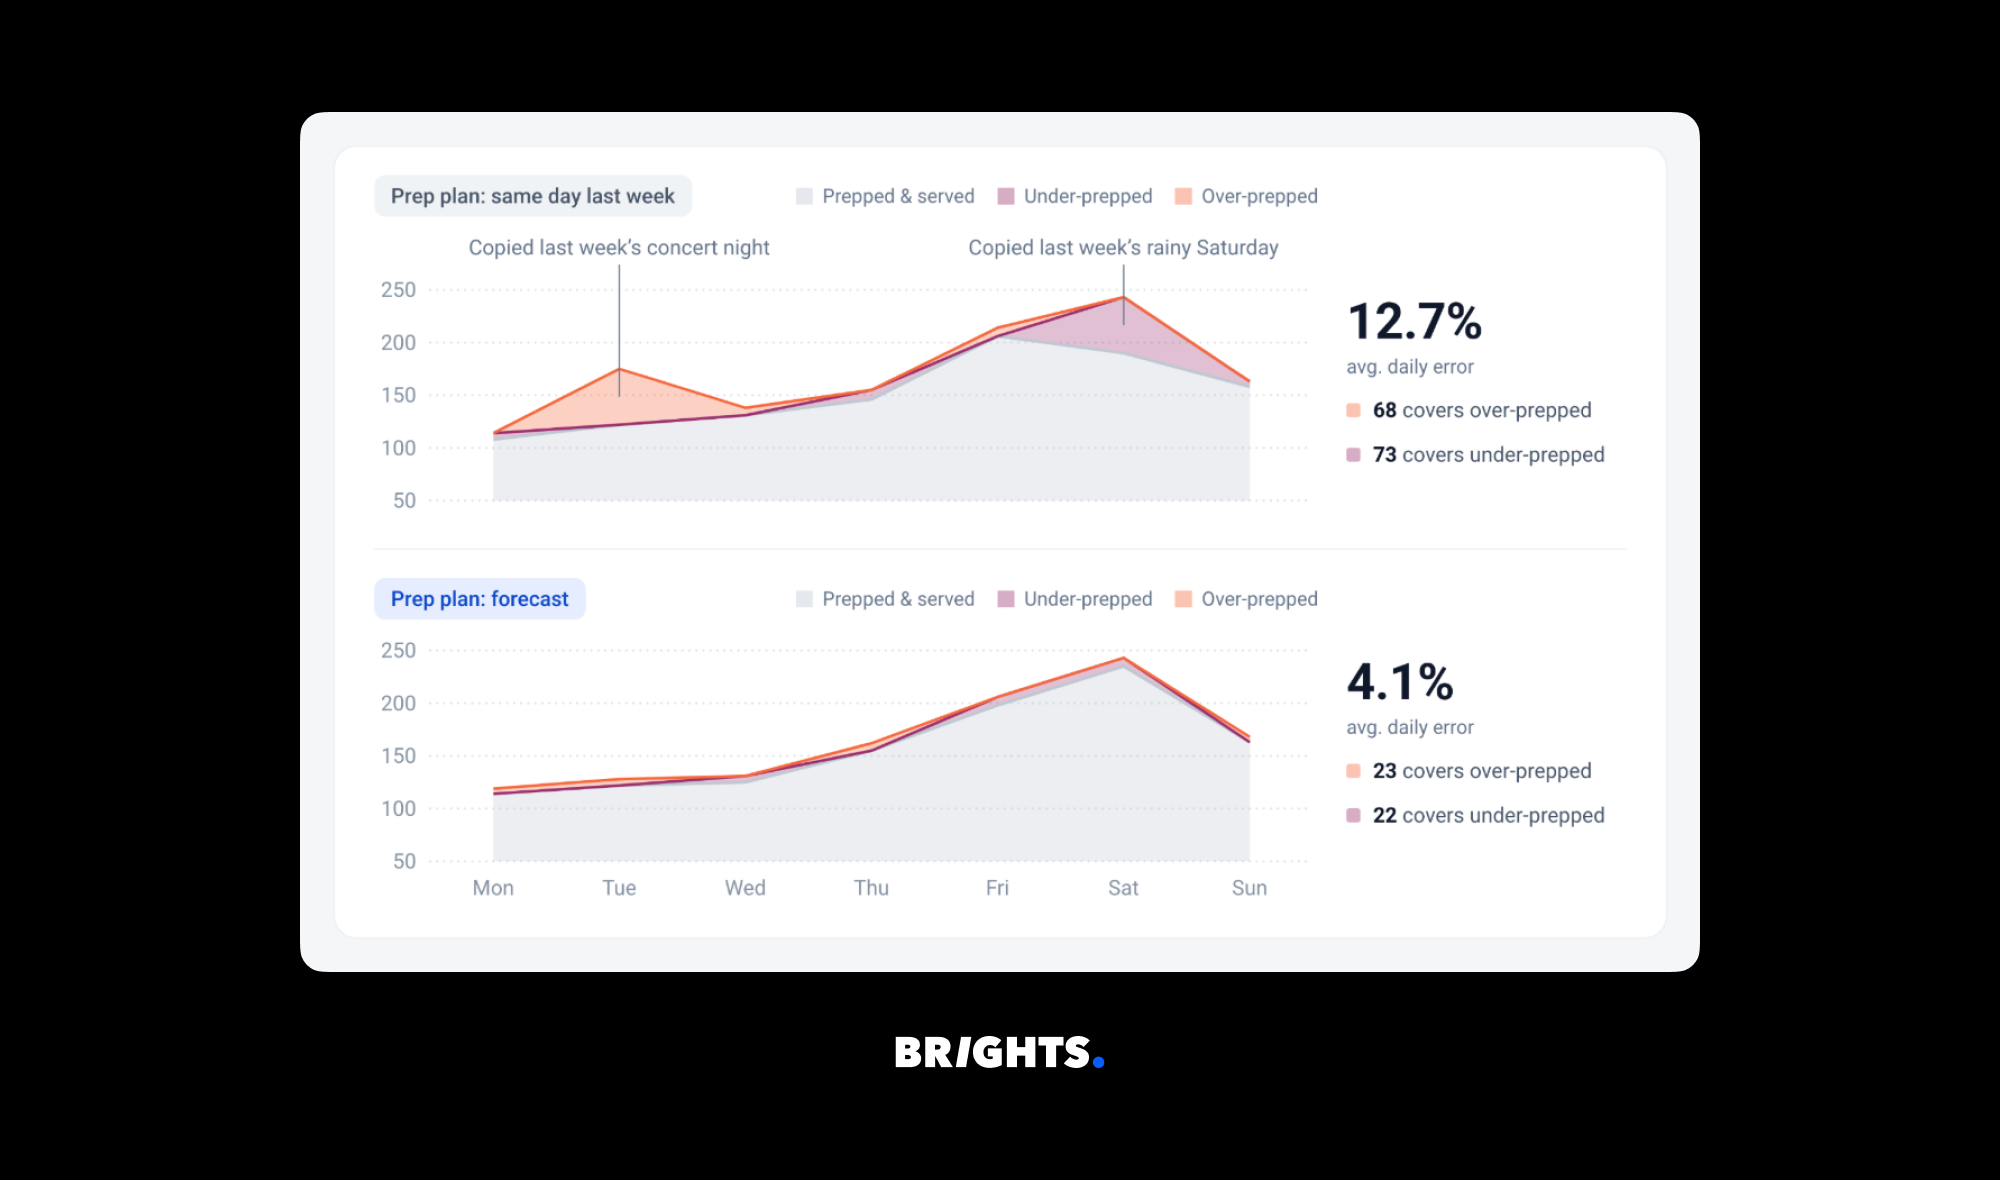
Instead of using a preparation sheet that says 'same as last Tuesday', restaurants now use one that is based on the day part, the weather, local events, and the length of time bookings have been made. It has been found that restaurants generally waste between 4% and 10% of the food they buy before it gets to a guest, and industry case studies have shown that combinations of inventory control and demand forecasting have led to reductions in waste ranging from 20% to 30%. The way this works is simple: order less, prepare nearer to the actual demand, and keep track of the food that is discarded.
Labor scheduling
The reward in terms of labor is greater and more important. According to figures from the NRA cited in industry reports from 2026, full-service restaurants had a median labor cost of 36.5% of sales, whereas those that remained profitable kept it at 34.2%. The 2.3-point gap is worth €23,000 a year on €1 million of sales. It is the sales-per-labor-hour targets set on a daily basis that closes that gap, and this, in turn, requires the forecast to be accurate.
Menu engineering and pricing
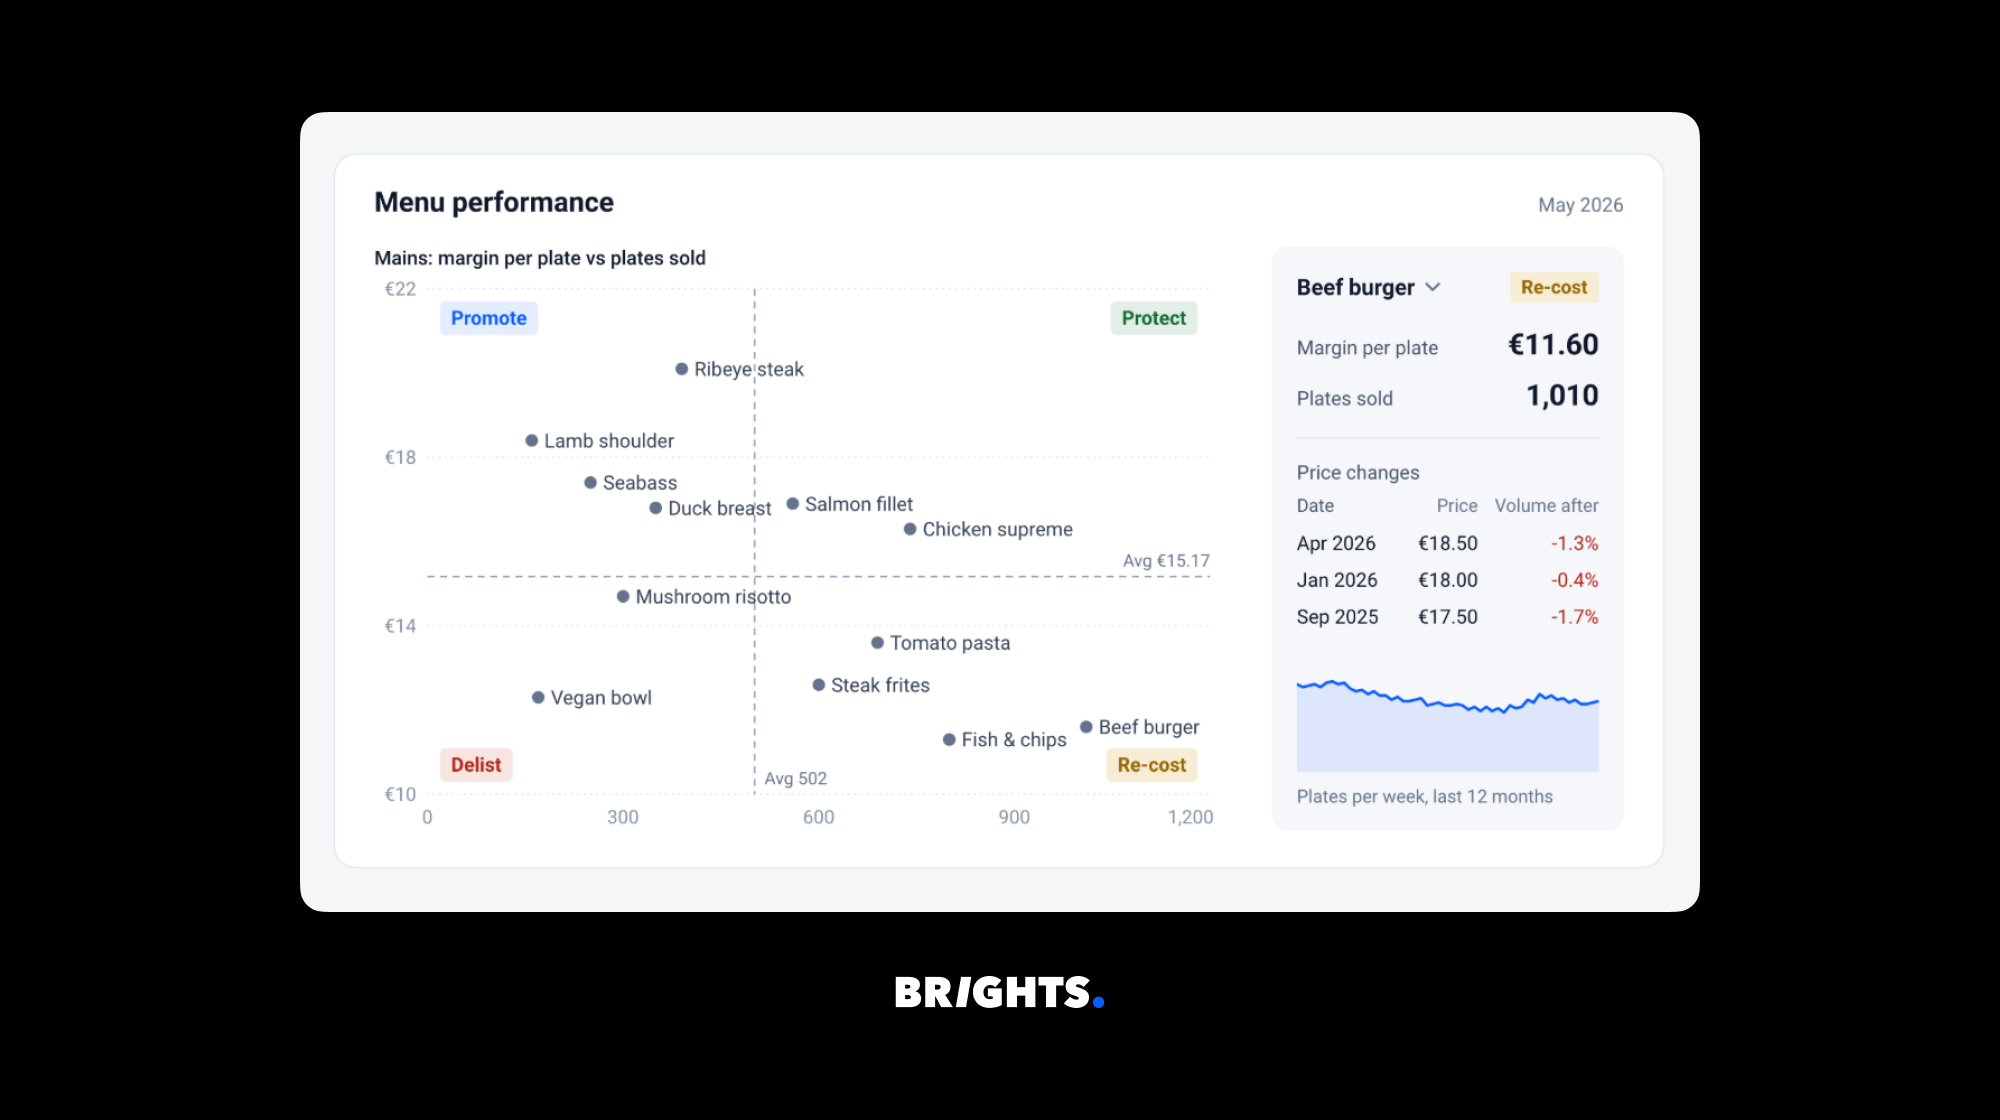
When the contribution margin per item is cross-referenced with sales velocity, four categories result: high margin and popular (protect), high margin and slow (promote or reposition), low margin and popular (re-cost or re-portion), and low margin and slow (delist). However, this approach is nothing new. The change now is that recipe costs can be automatically updated from invoice data rather than having to be manually revised once every quarter, a feature that makes a difference given how beef and produce prices changed throughout 2026.
Guest retention
The number of customers leaving is rising. As the Tillster 2026 Phygital Index shows, 45% of people interviewed said that their favorite restaurant chain has changed in the last year, compared with the 33% who said the same thing in 2025. Retention analytics — that is, tracking guests, measuring how often they return over a 90-day period, and then taking steps before the habit is lost — acts as a countermeasure. Deloitte's 2025 survey of restaurant executives found that 82% planned to increase their spending on AI, with 60% citing customer experience and 31% citing loyalty as the areas where they expected it to have an impact.
The 5 restaurant analytics dashboards you actually need
| Dashboard | Owner | Refresh | The decision it drives |
|---|---|---|---|
| Daily flash | General manager | Every morning | Whether yesterday broke pattern, and what to do about today |
| Labor by day-part | GM and area manager | Daily | Shift shape for the coming week |
| Food cost and variance | Head chef and ops | Weekly | Where stock is leaking |
| Menu performance | Chef and finance | Monthly | What to re-cost, re-portion, promote, or delist |
| Guest and channel | Marketing and finance | Monthly | Where retention and channel spend goes |
1. Daily flash
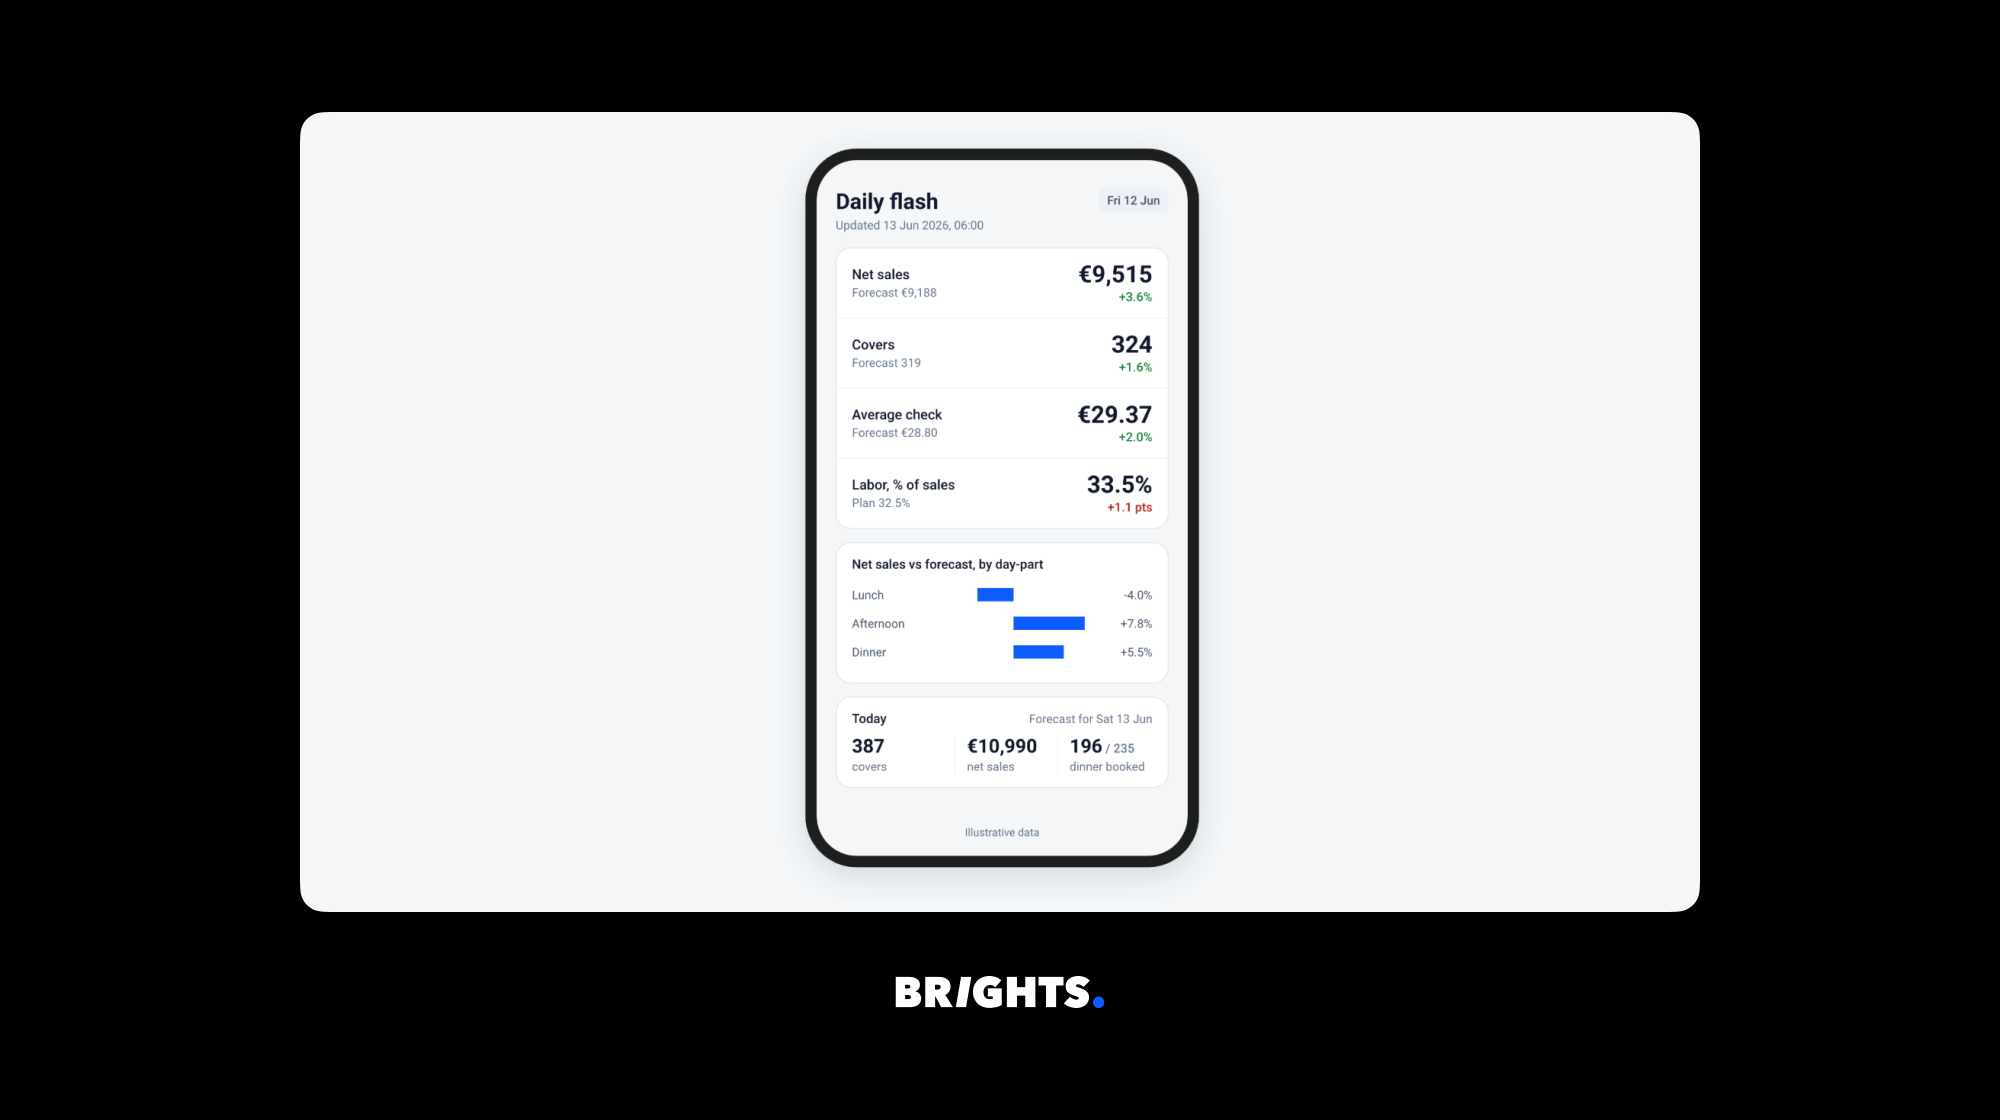
The figures for net sales, covers, average check, and labor percentage compared with the forecast for yesterday, by day part, are all that is included. This report is stored on a phone and read while standing there during the delivery signing process. It won't be read if it takes longer than 15 seconds to go through.
The most useful of the various fields is the variance relative to the forecast rather than to last year's figure, since last year does not inform a manager whether Tuesday was a bad day or a normal one.
2. Labor by day-part
Sales per labor hour, plotted by hour against the forecast, with scheduled hours overlaid on worked hours. That 36.5% versus 34.2% distance is closed by shift shape, not by cutting headcount, and shift shape is only visible at the hour level.
Add overtime exposure and the count of shifts that ran short-staffed. Restaurant365's 2026 mid-year research found 64% of operators were running below full capacity because of labor constraints, which is a revenue problem dressed as a cost problem.
3. Food cost and variance
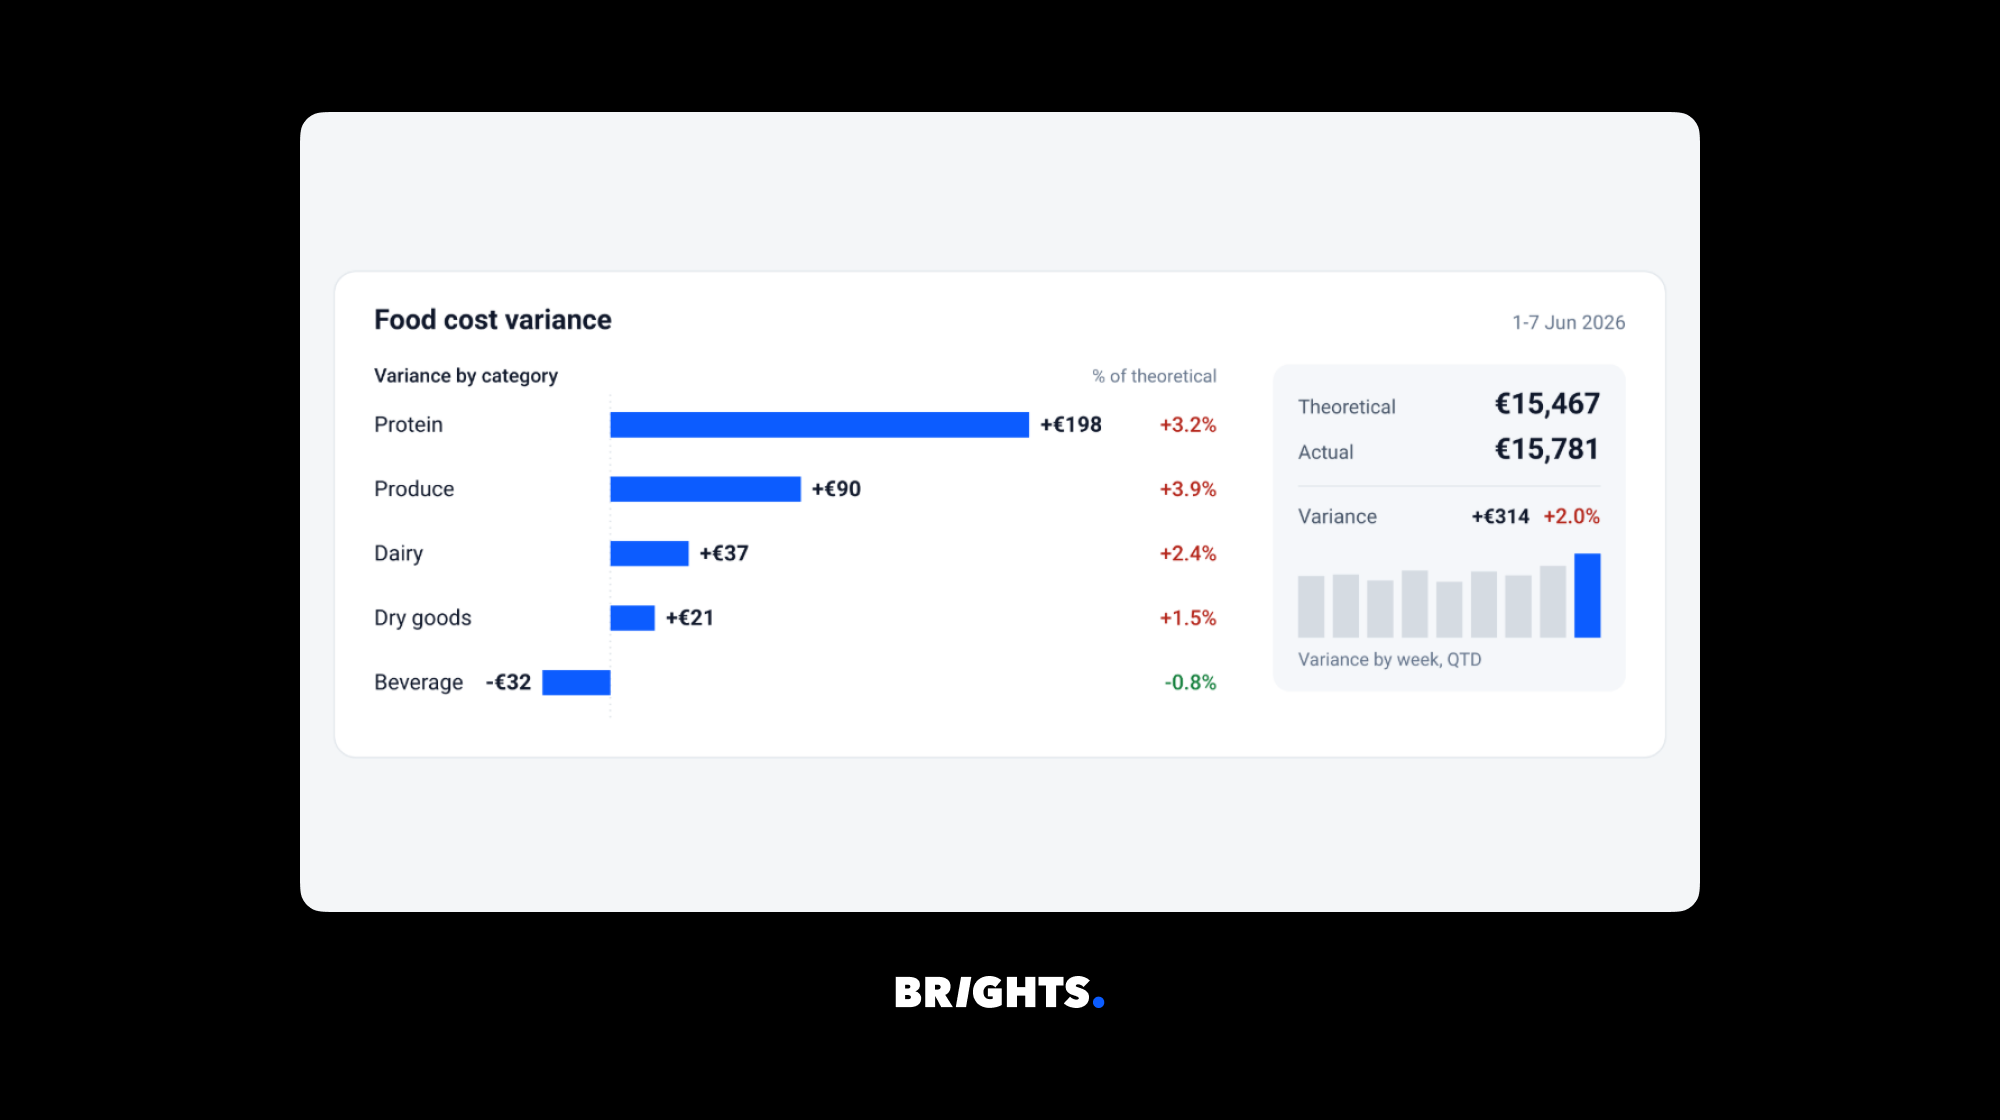
Theoretical usage from recipe-costed sales against counted usage, by category and by location, with the gap expressed in currency rather than percentage. A chef who sees €200 of unexplained protein variance this week acts faster than one who sees 3.2%.
Include supplier price movement on the top 20 ingredients by spend. In Restaurant365's survey, 87% of operators reported food cost increases in the first half of 2026, and recipe costs go stale within weeks when input prices move that way.
4. Menu performance
A graph showing the contribution margin per item in relation to sales velocity, with the data automatically updated from the invoice records, displays four quadrants and four corresponding actions: protect, promote, re-cost, and delist. It also shows the last three price changes for each item together with the effect on volume afterward, so that pricing decisions are no longer based on guesses.
5. Guest and channel
The repeat visit rate and net margin for each channel, with the costs of commission, packaging, and prep labor allocated back, are likely to surprise people, especially when looking at the delivery channel, since delivery is the area most unlikely to have its costs honestly determined.
Build, buy, or both in terms of data analytics for HoReCa operators?
There is no single right answer. There is a right answer for your unit count, your systems, and your appetite for owning software. Whether to build or buy software for a HoReCa business has no single right answer. There is a right answer for your unit count, your systems, and your appetite for owning software.
| Buy a platform | Build custom | Hybrid | |
|---|---|---|---|
| Time to first value | Weeks | 3 to 6 months | 6 to 10 weeks |
| Fits non-standard operations | Poorly | Fully | Mostly |
| Data ownership | Vendor-hosted | Yours | Yours for the warehouse |
| Cost shape | Per-location subscription rises with growth | Capital expenditure, then maintenance | Mixed |
| Multi-brand or multi-country | Often licensed separately | Handled in the model | Handled in the model |
| Best suited to | Single concept, standard POS, under ~15 sites | Multi-brand groups, unusual formats, proprietary channels | Groups with good POS coverage and custom booking or delivery flows |
Common mistakes that kill restaurant analytics projects
In Restaurant365's 2026 mid-year survey, operators who were not using AI were asked what was preventing them from doing so; data privacy and security came out as the main obstacle at 37 percent, output accuracy was next at 34%, cost followed at 29%, and 18% said they did not know where to begin. The failures listed below are beneath those responses.
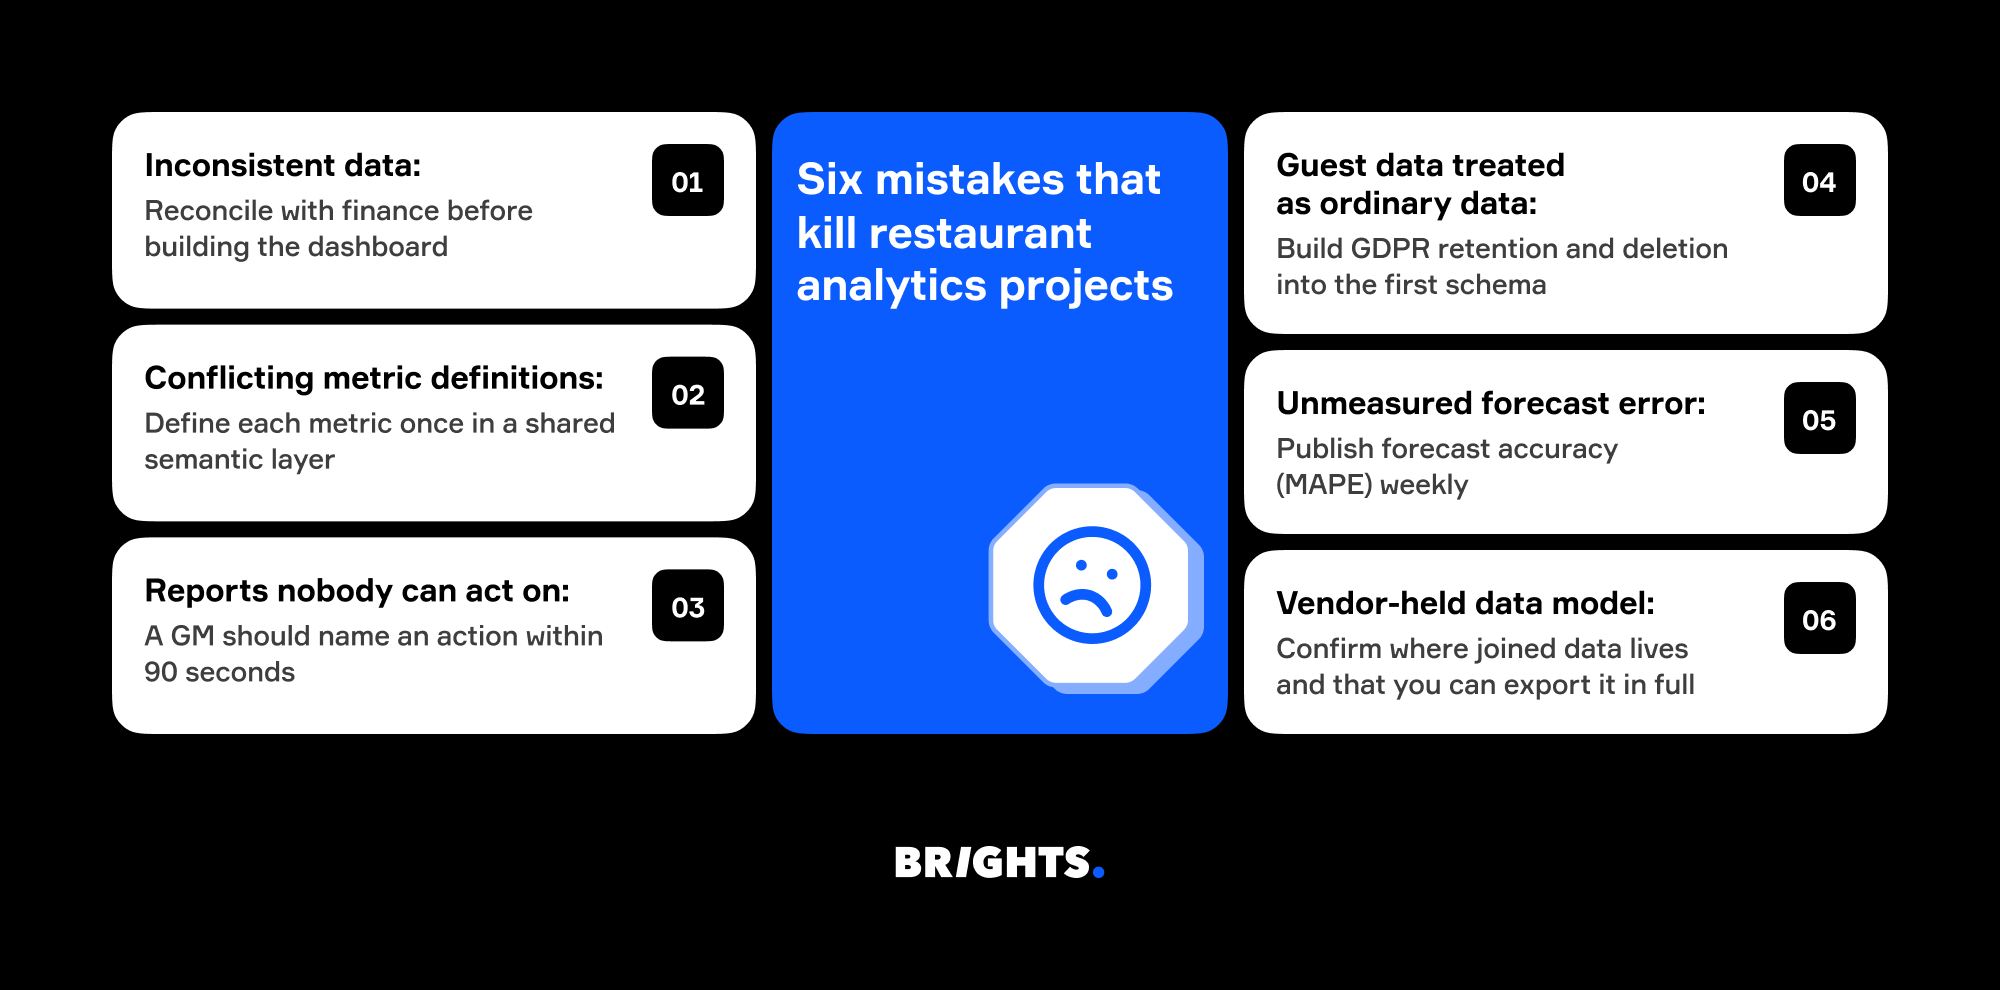
Data inconsistency. The data entries were recorded in an inconsistent manner, some items were renamed during the year, and one location was using a different POS build. Since the dashboard is based on this flawed data, it presents its figures confidently but incorrectly, and once a manager has noticed this mistake, they no longer trust the tool for good. The data should be reconciled with that of finance until the figures agree, and then the dashboard should be built.
Letting every function define the same metric differently. When finance, operations, and marketing each calculate their own way, every meeting becomes an argument about whose number is right. A semantic layer, one place where each metric is defined once, agreed in a room with the people who will argue about it, ends that permanently.
Shipping reports nobody can act on. A 6 a.m. email demanding interpretation gets ignored. The test is whether a GM can read the view and name an action inside 90 seconds. If not, it is just a data export.
Treating guest data as ordinary operational data. Under GDPR, a guest profile combining name, contact details, visit history, and dietary notes is personal data, and allergy or dietary information can touch special category data. Purpose limitation, retention periods, and a working deletion path belong in the first schema. Retrofitting them after launch means rebuilding the guest model.
Never measure the forecast's error. Teams publish the forecast and skip the accuracy. The kitchen quietly reverts to "same as last Tuesday," and nobody notices for a quarter. Publish the mean absolute percentage error weekly. A model that has earned trust through a visible track record gets followed; one that has not, will not.
Buying a platform without asking where the joined data lives. If the vendor holds your unified guest and transaction model, migrating later means rebuilding it from scratch. Ask where it physically sits and whether you can export it in full, before signing.
How Brights builds analytics for HoReCa
Brights has been building custom software since 2011, and booking systems are a core specialization: platforms where a client's own guests reserve tables, rooms, or time slots. That work sits directly on the reservation data that most analytics projects need and cannot reach.
What does that mean in practice for a hospitality group?
Integration engineering. Custom connectors for POS, booking platforms, supplier portals, and delivery aggregators, including systems with no supported API.
Warehouse and semantic layer. One model, one definition per metric, hosted where you choose and exportable in full.
Forecasting and scheduling models, built with the human-oversight and audit requirements that GDPR and EU AI Act workforce rules attach.
Guest-facing booking and loyalty platforms engineered under GDPR from the first schema.
Most engagements start with a discovery phase, a fixed-scope piece of work that maps your systems, defines your metrics, and produces a build plan you own.
FAQ.
Keep a record of the metrics that influence each decision. This involves the difference between theoretical and actual food cost, the contribution margin for each item, sales per labor hour according to the time of day, forecast accuracy (as measured by MAPE), the no-show rate, channel-level net margin, and the 90-day repeat visit rate. The figures for revenue and covers indicate what actually occurred; these seven indicators show where the margin is being lost and what should be changed this week.


