What Good Analytics and Reporting Look Like in SaaS Products

As subscription products grow, teams lean more on SaaS data analytics and reporting to understand what’s happening across the product and the business. Yet, decisions don’t necessarily get easier, especially when data is fragmented, inconsistent, or disconnected from real product workflows.
At Brights, we work with SaaS teams on data analytics and reporting systems that support real decision-making as products scale. In this article, we’ll show what effective analytics for SaaS looks like, which metrics actually influence action, and how dashboards can be designed to support confident product decisions.
Key takeaways
SaaS analytics breaks down not from a lack of data, but from fragmented tools, unclear metric ownership, and dashboards that track everything except what actually matters.
Effective analytics connects three layers (product behavior, customer context, and business outcomes) into a single, coherent picture.
Churn numbers arrive too late by definition. Early signals like dropping engagement, shorter sessions, and fewer completed actions give teams time to actually intervene.
Actionable dashboards are built around one specific decision and a tight set of metrics tied to it, rather than attempting to surface everything at once.
Analytics embedded directly into the product, right where decisions are made, builds more trust and sees more actual use than standalone reporting tools.
Accuracy, integrations, and privacy are design decisions from day one. They determine whether analytics stays trustworthy as the product scales.

Looker Studio implementation by Brights
Why SaaS companies stop trusting their analytics
It’s not that teams lack data. The challenge is trusting what that data really means.
With time, SaaS analytics tends to get messy as companies scale, and different teams layer on new tools for product, marketing, sales, and support. Usage statistics live in one tool, revenue data in another, and customer context somewhere else. In the end, the same metric looks “right” in one dashboard and questionable in another.
Dashboards and reports themselves can add to the problem: they track everything that can be measured, but not everything that matters. Without clear links to business goals, dashboards become passive reporting tools that fail to support real decision-making.
Another common issue is unclear ownership. When no one is explicitly responsible for defining metrics or keeping assumptions documented, analytics becomes something everyone uses, but no one actively maintains. This is often the point where a SaaS consulting team is brought in.
Trust in analytics also declines when it’s introduced too late. If you first turn to data only after growth slows or investors start asking harder questions, analytics feels reactive and (what’s worse) redundant.
What effective SaaS analytics looks like
When SaaS analytics works, you feel it in simpler ways: fewer discussions, quicker alignment, and clearer decisions.

That clarity starts with product analytics in SaaS. Product teams need visibility into how people move through the product: where they pause, where they return, or where they abandon a workflow halfway through.
Customer analytics in SaaS extends that picture beyond the interface. When it works properly, analytics connects behavior with context so that early signals become visible. For example, engagement usually drops before customers leave, and expansion tends to come from steady, purposeful use rather than one-off activity.
SaaS business analytics turns those signals into something leadership can work with. Revenue, retention, and growth don’t appear in isolation. They reflect how customers experience the product over time, and analytics works best when it makes that relationship explicit.
Key SaaS metrics that really influence decisions
While some metrics support reporting by describing what happened, other KPIs help you decide what to do next. This section focuses on the SaaS reporting metrics and general KPIs that fall into the second category.
Baseline SaaS reporting metrics
In most SaaS teams, reporting metrics are the numbers people check first because they give a sense of overall performance and whether things are starting to shift:
Monthly recurring revenue and its direction
Retention and churn over time
Activation and adoption across key features
Expansion and contraction within existing accounts
Usage trends by segment or product area
These SaaS reporting metrics help you stay oriented, so when one of them moves, it’s time for a deeper analysis: what caused the shift, where it started, etc. That’s when analytics adds context and helps you work with those signals.
Product usage metrics that explain behavior
Counting events or logins doesn’t answer important questions. Your team needs to understand how product usage unfolds over time and where it breaks down by looking into:
How people move through key workflows
Which features they return to over time
Where progress slows or breaks before users reach value
How usage shifts after releases or product changes
Metrics such as activation rates, feature adoption over time, or completion of key flows can also help you assess if the product is doing what it was designed to do.
Many teams prefer to see these signals together in one dashboard, like a Looker Studio dashboard for SaaS, rather than spread across different reports.
Customer health, retention, and churn signals
Customer health metrics matter most when they show change early enough to respond. Churn numbers rarely do, and by the time they appear in monthly reports, the underlying issues have usually been there for some time.
For the best result, SaaS product teams should combine usage patterns with context:
Gradual drops in engagement
Shorter or less frequent sessions
Fewer meaningful actions completed per visit
Changes in how core features are used
Looking at these signals together gives you time to reach out, adjust onboarding, or rethink product decisions before customers leave.
Revenue and growth metrics
To be useful for planning, revenue metrics need to stay close to behavior. After all, monthly recurring revenue, expansion, and contraction don’t happen independently of how the product is used.
That often means analyzing:
Net revenue retention
Expansion and contraction by segment
Revenue tied to specific usage patterns or product areas
However, knowing which SaaS metrics matter is only half the work. The more challenging part is putting them in front of teams in a way that really supports predictive decision-making.
Designing SaaS dashboards that people want to use
Of course, most SaaS companies already use dashboards. The problem is that often those dashboards aren’t useful enough. The key is understanding how dashboards can do more than just display numbers.
What makes a dashboard actionable
Dashboards have to answer specific questions your team faces regularly. Because when they try to cover everything, dashboards usually end up helping with nothing in particular.

Good dashboards make it obvious when something needs attention, so an actionable dashboard should focus on:
A clear goal or decision it supports
A small set of metrics tied directly to that goal
Context that explains whether a change is expected or a problem
For instance, a product manager tracking feature adoption doesn't need to see every metric. They need new feature usage rates, drop-off points in the onboarding flow, and time-to-first-value, since that's the data that drives decisions about what to improve next.
Embedded analytics inside the product
Dashboards in SaaS products often serve more than internal teams. Customers also depend on analytics to understand how they use the product and what results they’re getting from it. When that data lives outside the product, people end up switching between tools, trying to make sense of unfamiliar charts.
Embedded analytics, which evolves alongside broader product shifts like how AI is transforming SaaS products, takes away that hassle by fitting into how people already work. Instead of sending users to a separate reporting space, insights show up right where decisions are being made. Usage trends might sit next to configuration options, and outcomes appear inside the features they relate to, which makes analytics easier to use and trust.
Custom dashboards vs. third-party SaaS reporting tools
As SaaS companies grow into enterprise organizations, they may start weighing third-party analytics against custom dashboards. The difference usually isn’t about features but about control, effort, and how well standard reporting fits specific product workflows.
Third-party tools work well for common metrics like churn and MRR, while custom dashboards are great when analytics needs to closely mirror product behavior.
Here’s a closer look at the difference between custom dashboards and third-party tools:
| Aspect | Custom dashboards | Third-party tools |
|---|---|---|
| Alignment with product logic | Closely matches how the product works and how data is defined | Limited by predefined models and assumptions |
| Flexibility | High: teams can adapt dashboards as the product evolves | Lower: customization depends on the tool’s constraints |
| Time to initial setup | Slower: requires design, development, and iteration | Faster: dashboards can be up and running quickly |
| Ongoing maintenance | Requires clear ownership and continued effort | Largely handled by the vendor |
| User experience | Can be tailored to internal teams or end users | Follows the tool’s standard UI patterns |
| Risk of drift | Lower if definitions are owned internally | Higher if the tool diverges from product reality |
How to turn SaaS data into decisions
Here are some practical habits that help SaaS companies move from reviewing data to acting on it with confidence.

Use analytics before decisions are locked in
Analytics is most useful when there’s still room to change course. During planning, early signals help you compare options, question assumptions, and drop weaker ideas before wasting time and resources on them.
That matters when you’re deciding whether to roll out a new onboarding flow, figuring out where to focus retention work as engagement dips, or validating priorities in your SaaS product roadmap before choices become hard to undo.
Know who owns the next step when data changes
Ownership means agreeing in advance on three things:
Which metrics require a response
Who is responsible for that response
What a response actually looks like
For example, a drop in activation might belong to the product team, while a decline in expansion could trigger a review by sales or customer success. In both cases, the owner isn’t expected to “fix” the number immediately, but to investigate, explain what’s happening, and offer next steps.
One more tip: instead of assigning someone to monitor metrics, assign responsibility for what happens after a change is noticed, whether that’s running deeper analysis, adjusting a plan, or confirming that no action is needed right now.
Separate noise from meaningful change
SaaS metrics naturally go up and down, and jumping on every dip or spike creates more noise than progress. For example, a short-term drop in usage might be expected after a release, but a steady decline across activation, feature adoption, and session depth points to a deeper issue.
But that doesn’t mean you have to eliminate the noise. Instead, establish what “normal” looks like for your product and use that baseline to spot changes that deserve attention. Over time, this will reduce knee-jerk reactions and keep the focus on issues that will matter a week or a month from now.
Common analytics issues in SaaS products
More users, features, and tools increase the volume of data and, consequently, introduce new points of failure.
Accuracy and trust
One of the most common pitfalls is assuming that data accuracy will take care of itself. In reality, accuracy deteriorates gradually: definitions change, tracking logic evolves, small inconsistencies accumulate over time... And then teams start noticing things like:
The same metric reported differently across tools
Unexplained jumps or drops after product changes
Numbers that can’t be traced back to a clear source
The good news is that clear ownership and regular checks can help you catch issues before they grow.
Integrations
When SaaS products start using third-party billing systems, CRMs, and support platforms, analytics becomes fragmented, and conclusions drawn from one system may conflict with insights from another. Integration issues usually show up as mismatched identifiers, delayed data, or reports that reflect only part of the customer journey.
Fortunately, integrations can improve when teams focus less on adding tools and more on helping existing systems work together, aligning on shared entities, expected delays, and revisiting setups after changes.
Privacy and scale
As products reach larger audiences, analytics decisions carry more responsibility. Data volume grows quickly, and so do expectations around privacy and compliance. SaaS teams especially struggle when:
Data collection expands without clear limits
Sensitive data ends up available to more people than intended
Historical data is kept indefinitely without an apparent reason
Analytics environments are shared across teams without clear boundaries
The fix is to treat privacy and scale as part of analytics design, closely tied to decisions around SaaS infrastructure architecture, data access, and long-term storage.
Real example: What changes when analytics is built intentionally
Before the setup, our client’s marketing and sales teams spent several days on report preparation, exporting data from HubSpot, Google Analytics 4, Search Console, Google Ads, and internal finance systems. Reports lived in spreadsheets, numbers often didn’t line up, and meetings stalled on validating data instead of deciding what to change next.
Our goal wasn’t to add another report, but to create a shared, reliable view teams could use during planning and review meetings. Brights built a Looker Studio dashboard for SaaS structured around the questions teams needed answered, not around individual tools or channels.
As a result:
Reporting time reduced from days to minutes
Marketing and sales aligned on shared definitions
Performance compared in real time across channels
Meetings focused on actions instead of reconciling numbers
Analytics integrated into planning and review workflows
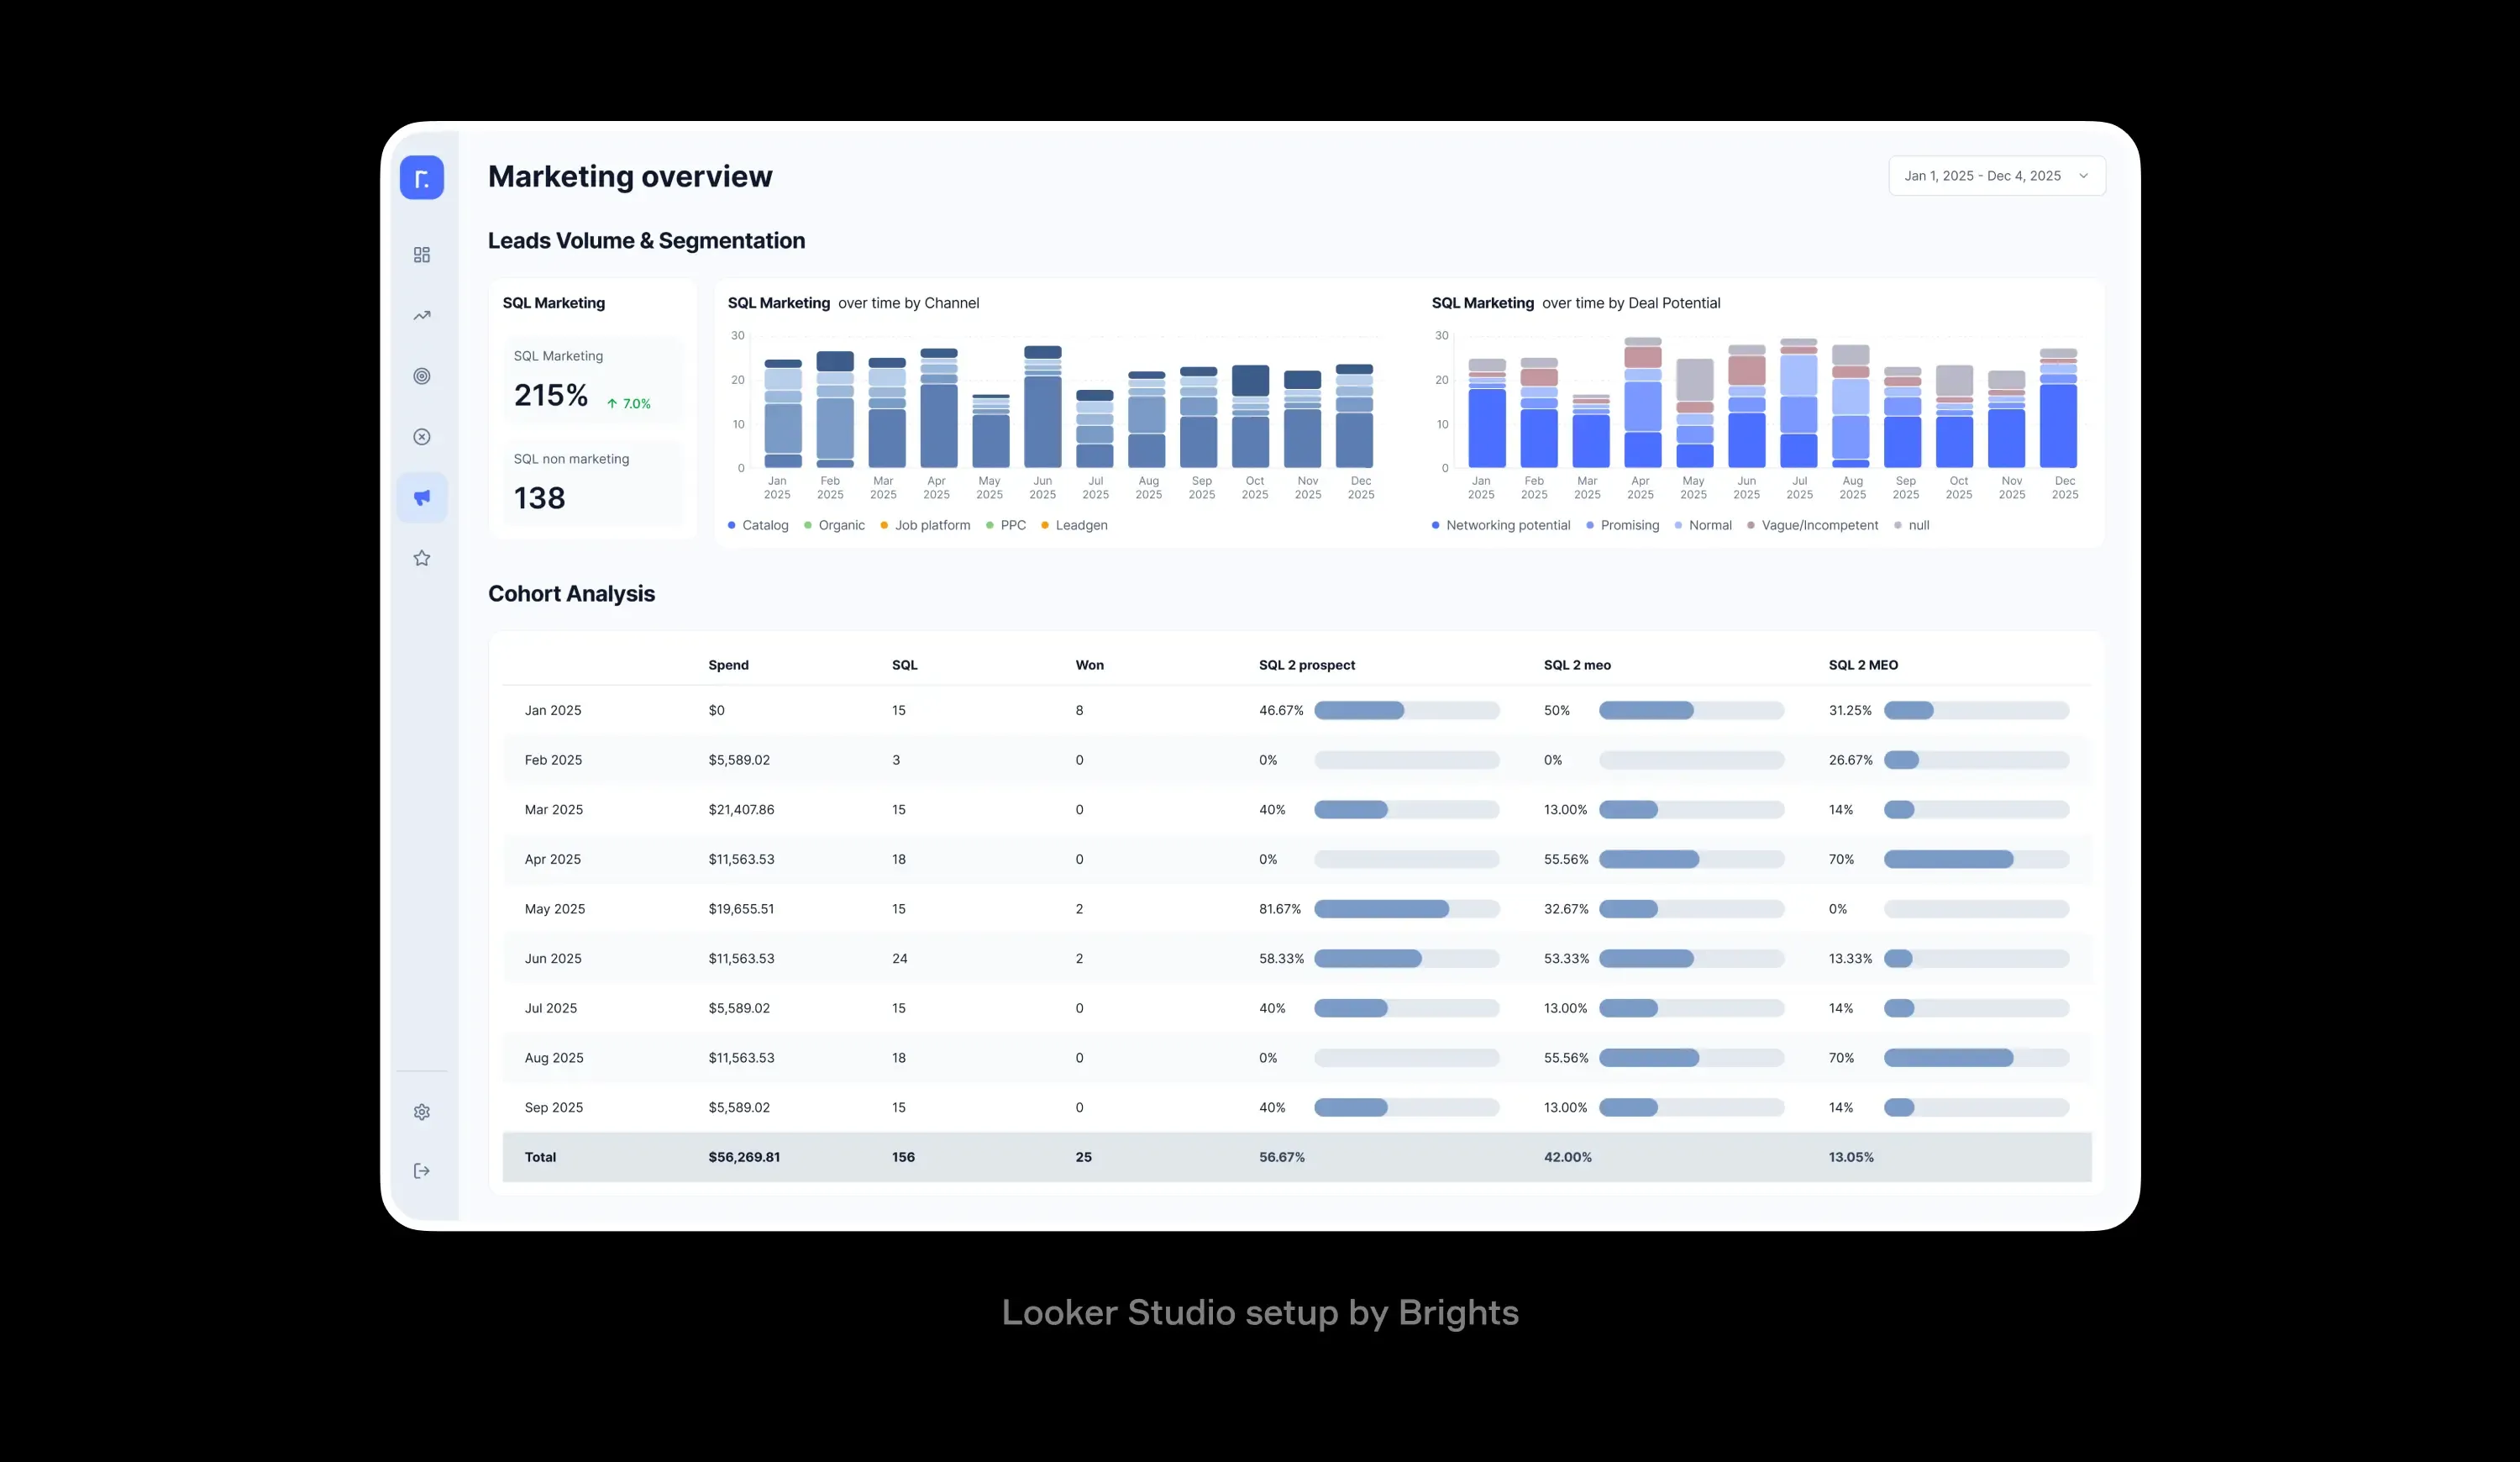
Marketing dashboard in Looker Studio. Implemented by Brights
Conclusion
Good analytics and reporting in SaaS come down to a few practical choices. Teams need a shared set of reporting metrics, clear ownership over definitions, and dashboards that reflect how the product and customers actually behave. When analytics is tied to real decisions, it reduces guesswork and shortens the path from signal to action.
This is the approach Brights takes as a SaaS development company when building analytics and reporting systems: focusing on clarity, consistency, and scalability from the start, so teams can rely on their data as the product grows.
FAQ.
Look for a partner who demonstrates deep expertise in your industry, offers scalable solutions that integrate with your existing tech stack, and prioritizes collaborative problem-solving. The right partner will also take time to understand your specific business goals and provide transparent insights into their methodology, pricing, and support structure.

