Data Studio vs Power BI: Pricing, Features, and Fit

Data delays cost decisions. When dashboards lag or tools fail to sync, teams lose the window to act on what the numbers show, which is why choosing between Power BI and Looker Studio (now Data Studio) carries real weight. The choice determines whether the analytics tool speeds decision-making or slows it down.
“Both platforms are dominant in the market, but the 'best' choice isn't the same for everyone. Data Studio vs Power BI debate ultimately depends on matching platform capabilities to a specific business context: your team's size, technical expertise, and existing tech stack. If you work in an enterprise environment, heavily rely on Microsoft tools, and require advanced analytics, Power BI might be a better choice. And if your team values simplicity, cost-effectiveness, and Google Workspace connectivity, Looker Studio will likely be your go-to option.”
— Anastasiia L., project manager, Data Studio expert at Brights
Business requirements are rarely this clear-cut. Brights builds custom software and implements data analytics tools across industries, which is the vantage point behind this comparison of Google's Data Studio and Microsoft's Power BI: dashboard performance, adoption complexity, and cost, the factors that most often shape a client's decision.
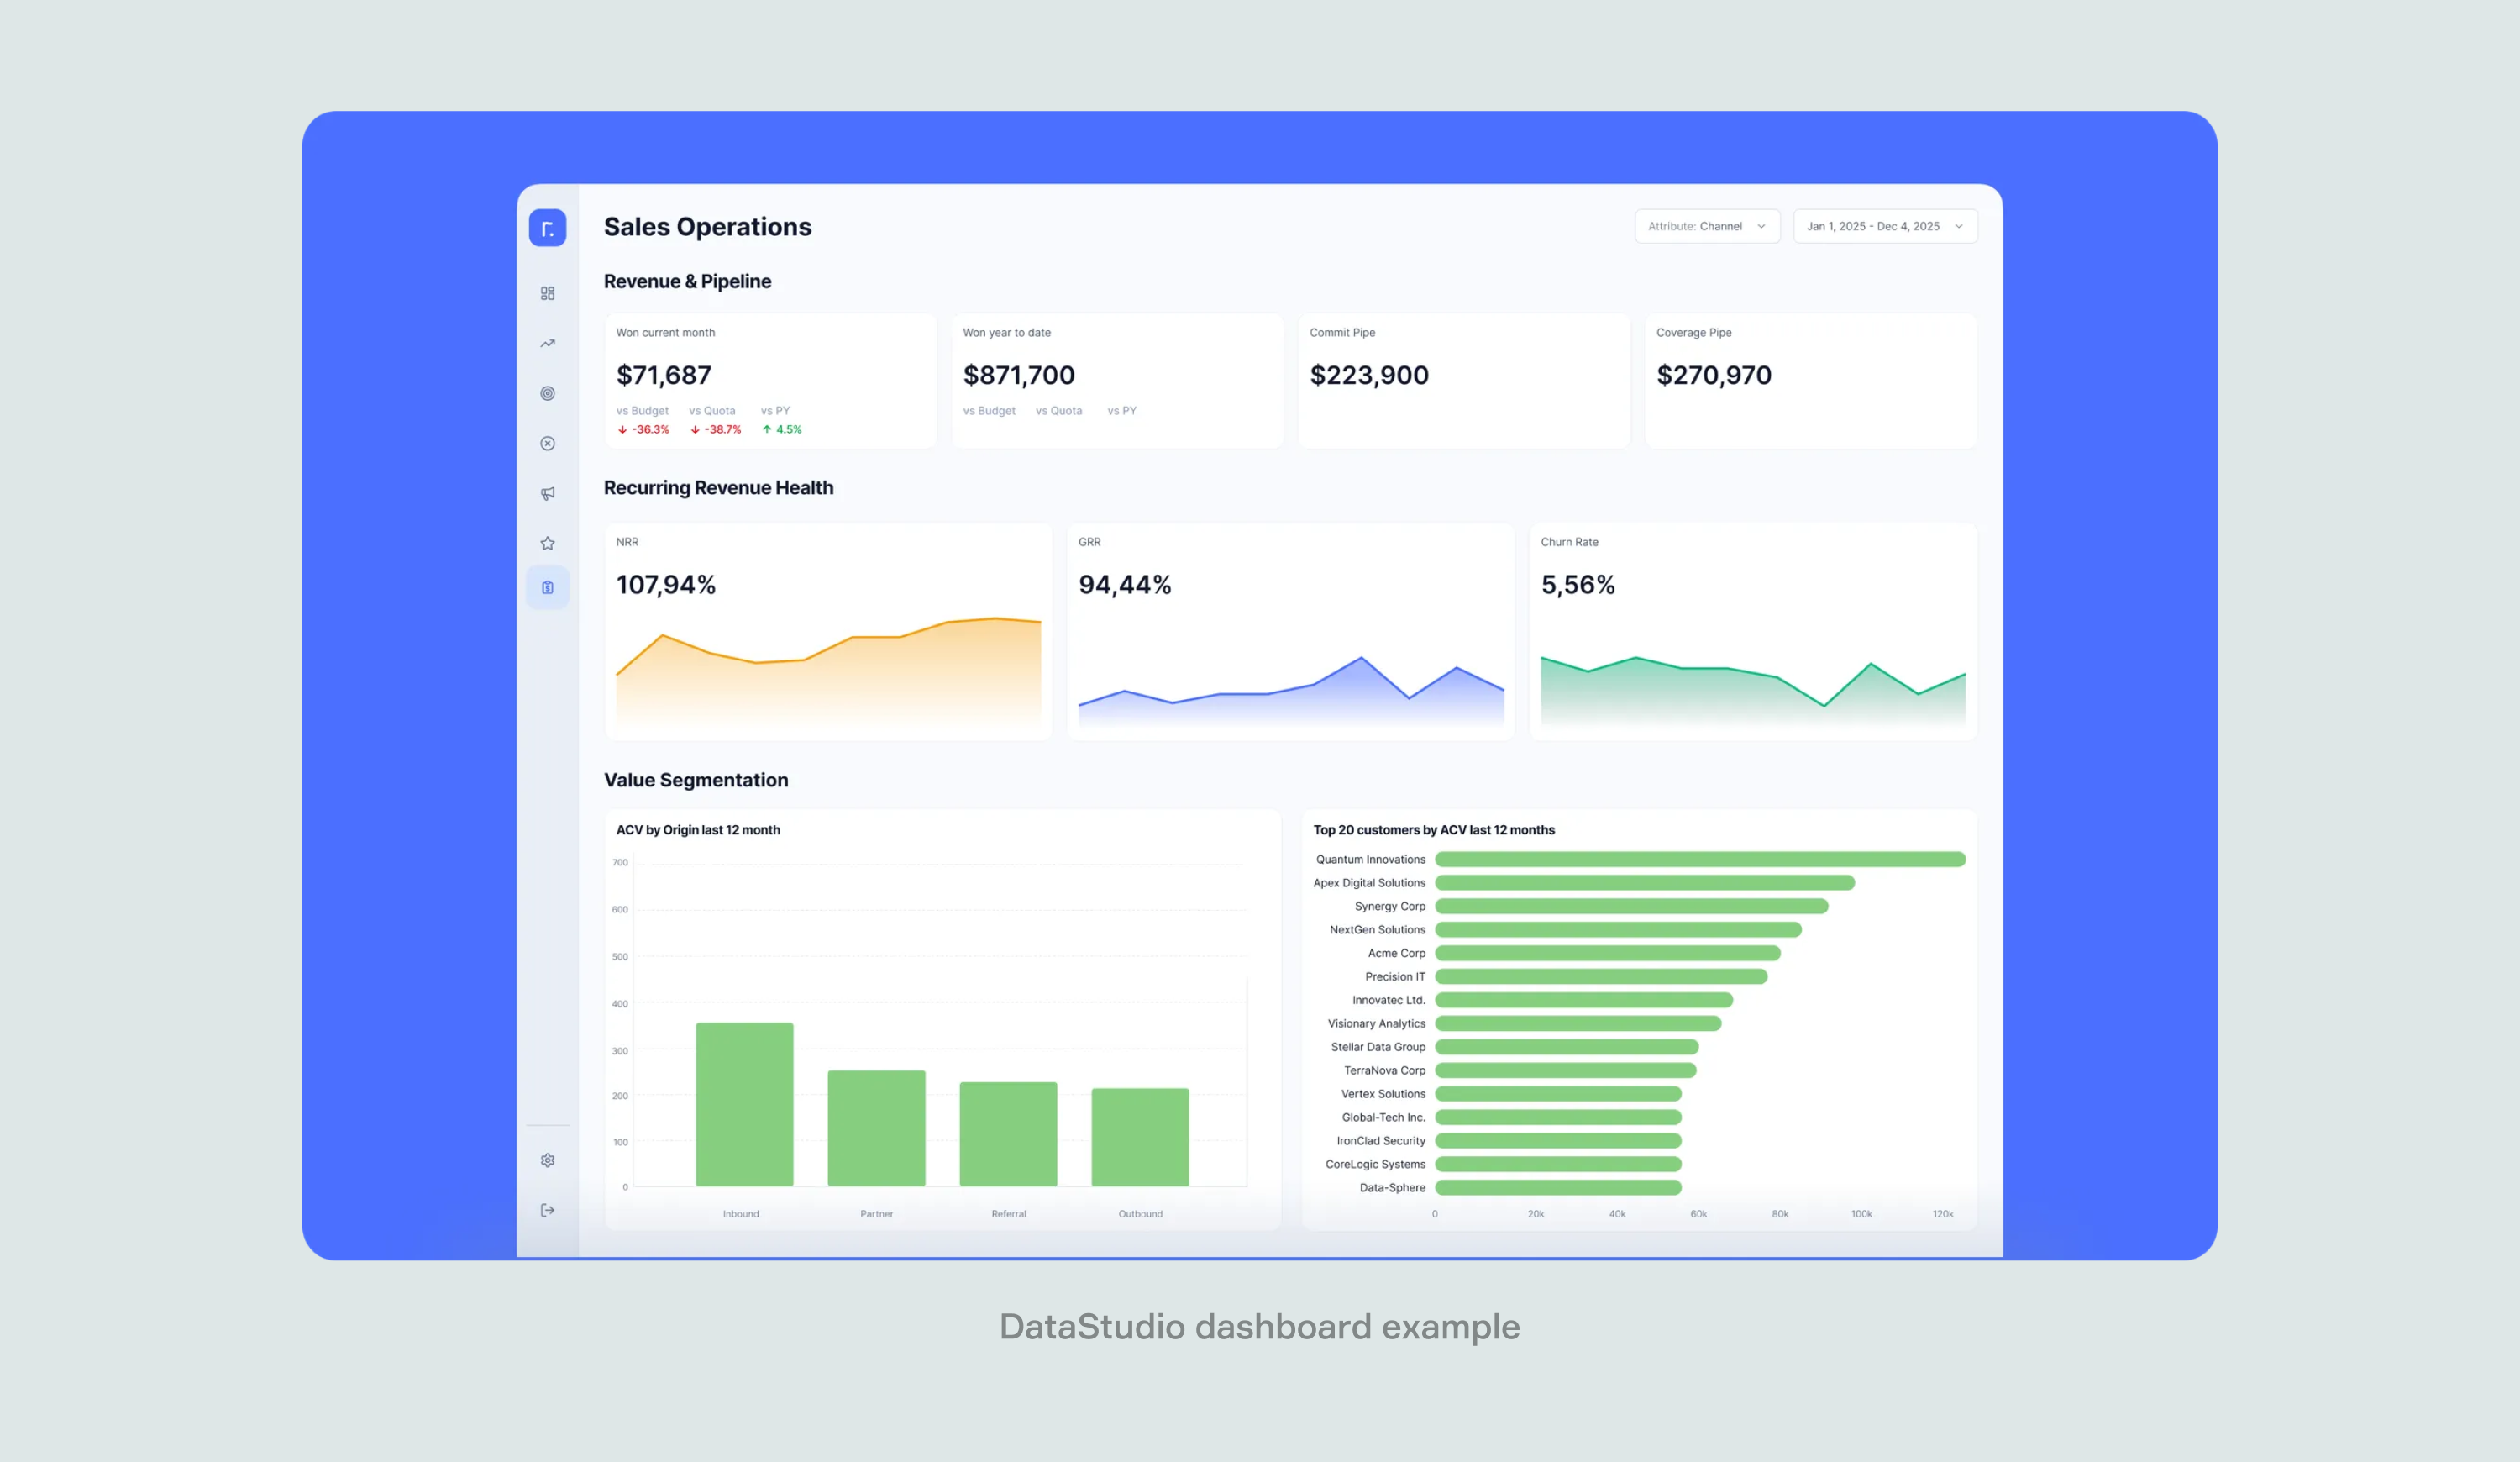
Data Studio setup for an IT company, implemented by Brights
Key takeaways
Ecosystem alignment comes first: the Power BI vs Data Studio choice depends primarily on a company's Google or Microsoft stack.
Google reversed its 2022 rebrand in April 2026, returning Looker Studio to its original name, Data Studio; the free tier and Pro pricing carried over unchanged.
Hidden costs rival licensing fees: third-party connectors, admin overhead, IT support, and training time inflate total expenses beyond the sticker price.
Data Studio performance degrades on datasets over 100,000 rows; BigQuery pairing remains the standard fix for larger datasets.
Data Studio takes 1 to 2 weeks to learn; Power BI requires 4 to 8 weeks for DAX and data modeling proficiency.
Analytics goals set the direction: client-facing dashboards favor Data Studio, deep cross-department analytics favor Power BI.
Tableau enters the comparison for teams that weigh visualization depth as heavily as ecosystem fit, at a materially higher price point.
Data Studio vs Power BI in 2026: how do they compare?
Data Studio is a free business intelligence and data visualization tool platform developed by Google. It launched as Google Data Studio in 2016, was rebranded to Looker Studio in 2022 following Google's acquisition of the enterprise BI company Looker, and returned to the Data Studio name in April 2026, with Google citing ongoing confusion between the free tool and the separate enterprise Looker platform.
Microsoft's Power BI, by comparison, targets large enterprises with deeper business intelligence capabilities, at a higher cost than Data Studio.
Every case carries its own nuance, but the table below lays out the distinctions that matter most when choosing an analytics platform for a growing business.
| Feature | Looker Studio | Power BI |
|---|---|---|
| Target audience | Marketers, small-to-medium teams, Google users | Enterprise teams, data analysts, Microsoft users |
| Pricing model | Free (with Google sources), Pro at $9/user/month | Free (Power BI Desktop for individual authoring), Pro at $14/user/month, PPU at $24/user/month |
| Primary strength | Simplicity, Google integration, cost-effectiveness | Enterprise-grade modeling, Microsoft stack integration |
| Data sources | 20+ free Google connectors, paid third-party connectors | 200+ native connectors, extensive enterprise sources |
| Learning curve | Minimal. Designed for business users. 1–2 weeks for basic proficiency | Moderate to steep. 4–8 weeks for DAX (Data Analysis Expressions) and data modeling |
| Best for | Marketing analytics, Google-heavy environments | Complex enterprise BI, advanced analytics |
The choice ultimately comes down to ecosystem fit and complexity needs. Microsoft's 40% Power BI Pro price increase, effective April 2025, widened the existing cost gap between the two platforms considerably: Power BI Pro now costs more than 50% more per user than Data Studio Pro.
For large enterprises, Power BI holds its ground: advanced data modeling and deep Microsoft integration justify the higher price tag for complex BI needs. Data Studio's free tier and simplicity, paired with BigQuery for larger datasets, remain attractive for companies working with tighter budgets.
Integrations & data sources
Teams, especially marketing departments, juggling multiple channels and touchpoints depend on connecting and visualizing data quickly; attribution efforts fall apart without it. Data Studio and Power BI take different approaches to this problem.
Data Studio is built for teams working inside Google's ecosystem. Native integration with GA4, Google Ads, BigQuery, and Google Sheets pulls campaign performance, website analytics, and conversion data directly, without the authentication or API setup that third-party tools often require.
Across the client work Brights has done in this space, native setup typically cuts the time spent building dashboards from months to weeks, which frees teams to focus on insights instead of integrations. The same speed becomes a budget lever when teams need to spot underperforming campaigns and reallocate spend fast.
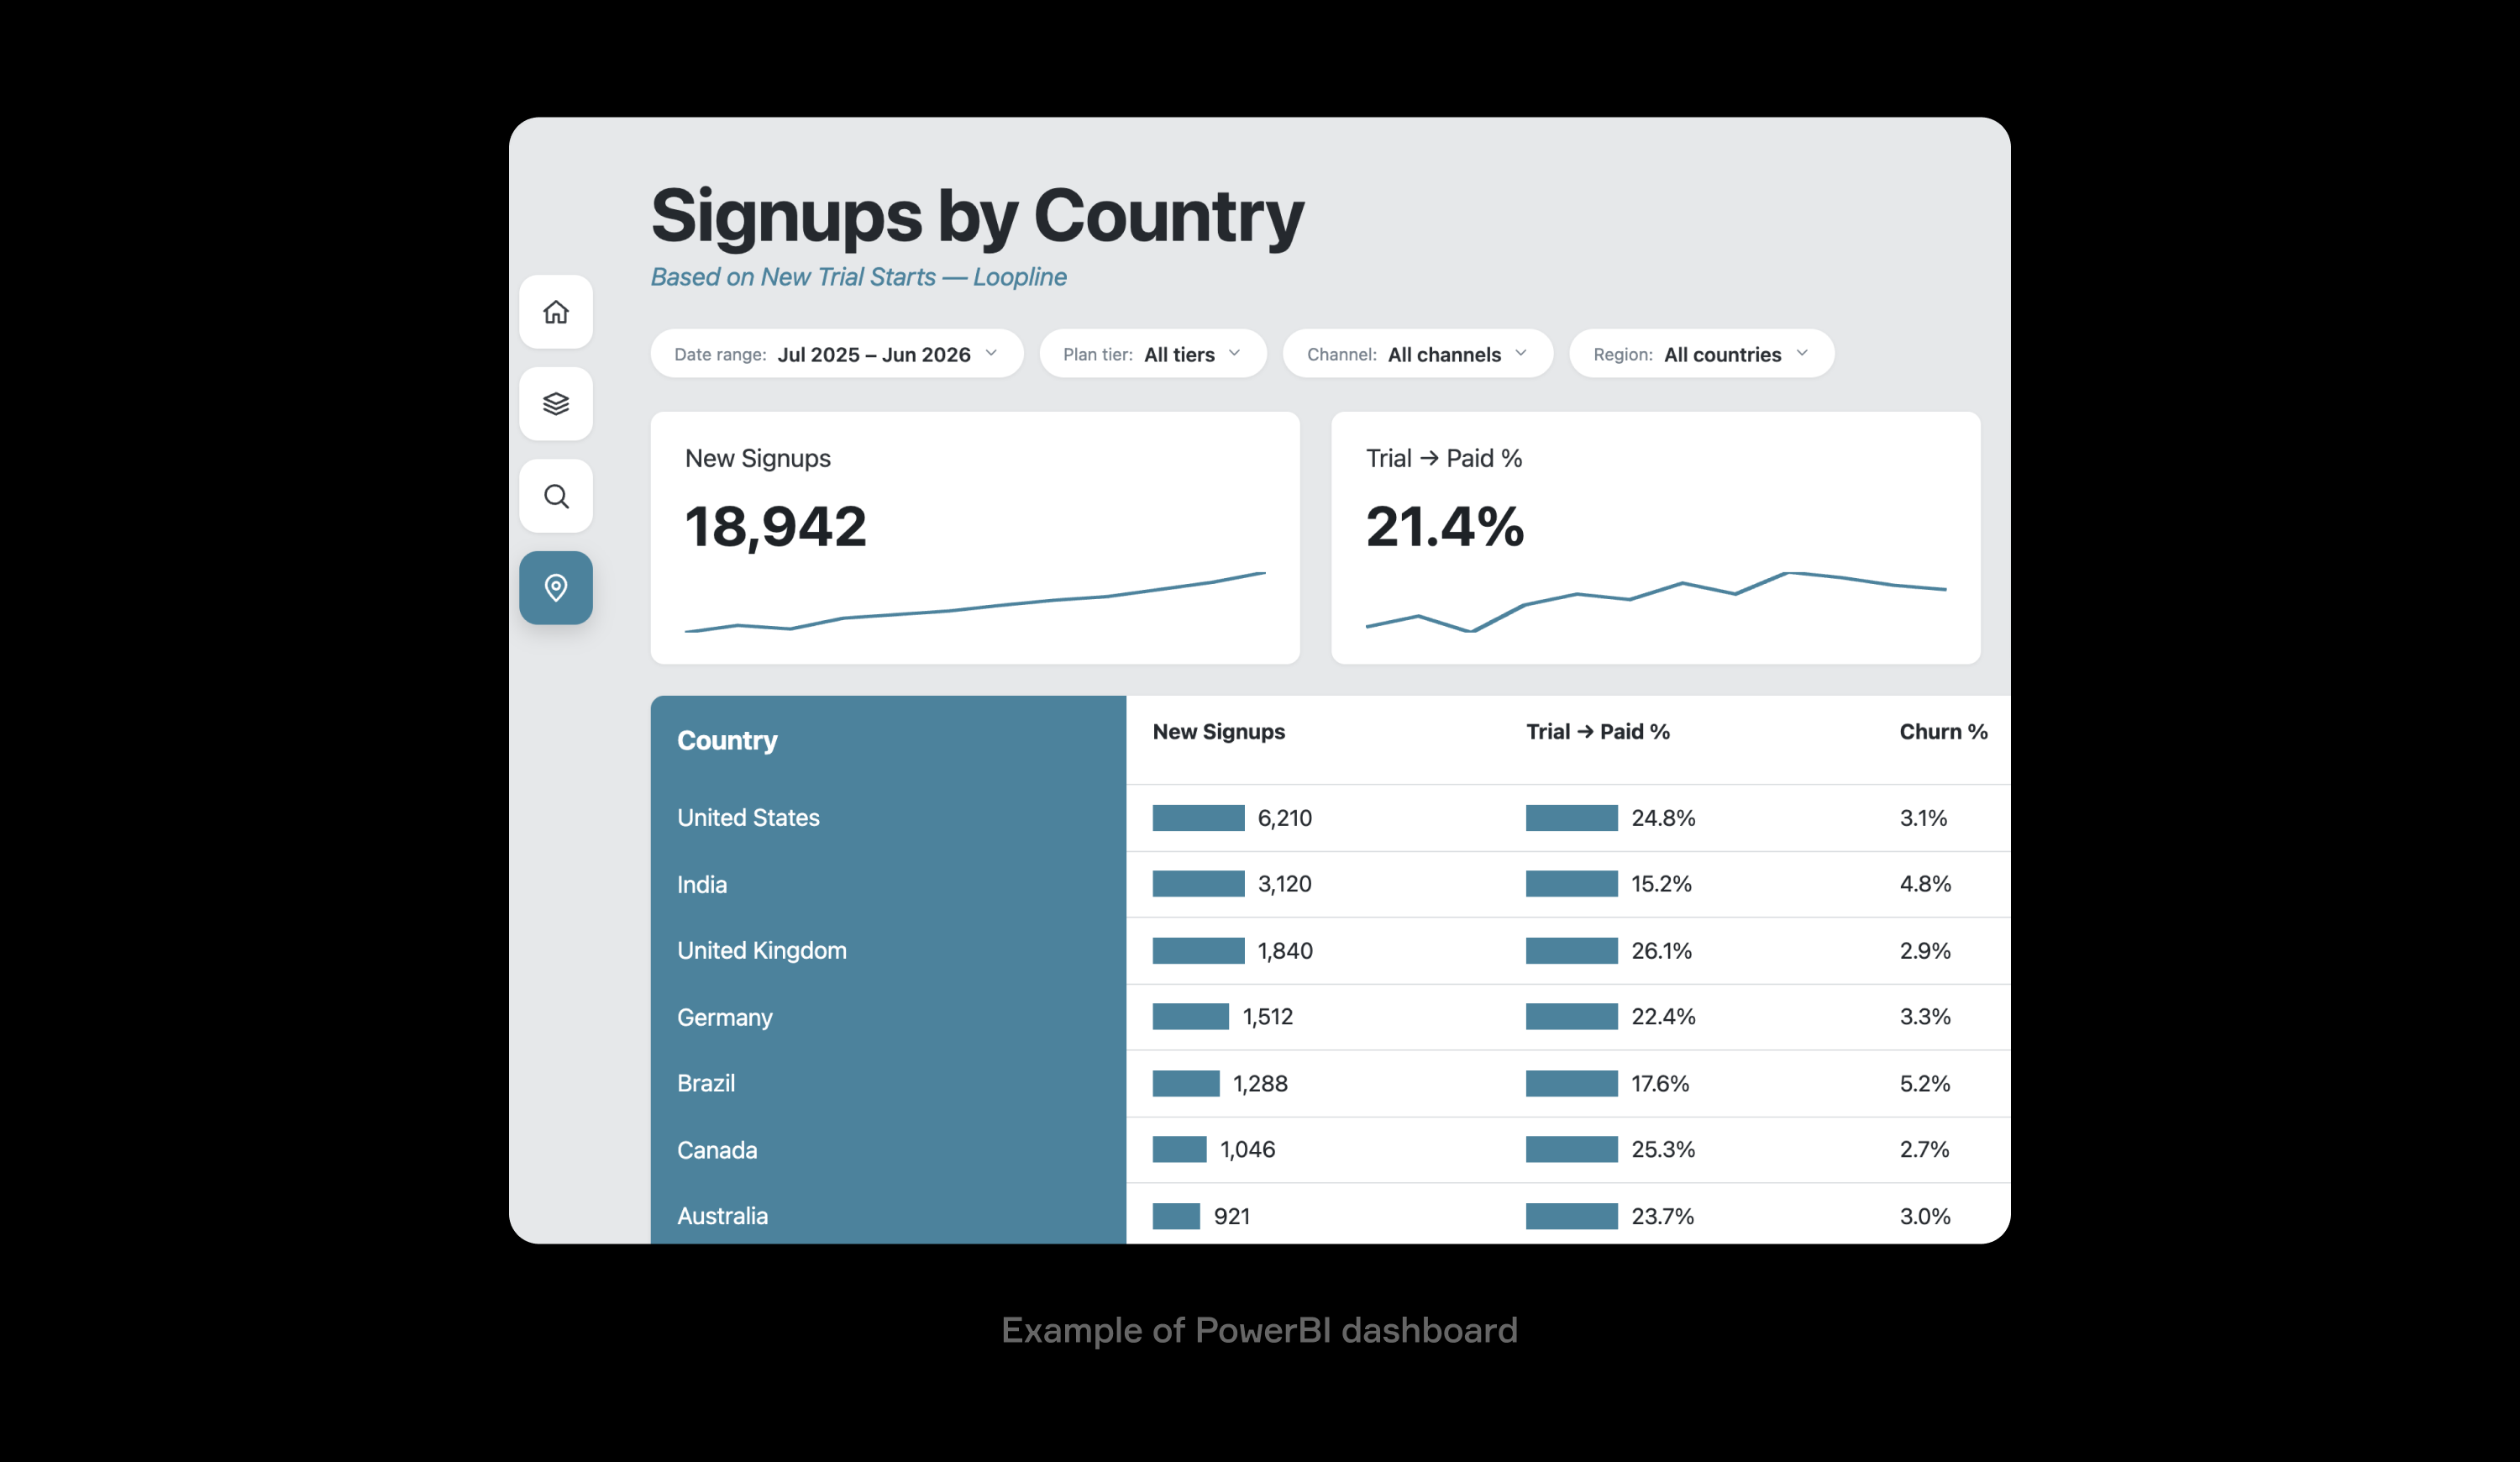
Power BI takes an enterprise-focused route, working best with SQL Server, Azure databases, and Excel files. It excels at merging marketing metrics into broader business intelligence, calculating customer lifetime value by combining CRM data with campaign performance, for example. Cross-departmental insight is where Power BI earns its keep: it pulls together marketing, sales, finance, and customer success data. Platforms like Facebook Ads or LinkedIn connect only through workarounds or paid third-party tools.
Data Studio and Power BI converge on one point: both work well with Supermetrics and other third-party connectors, which narrow the gap in pulling data from multiple sources, including Facebook, HubSpot, and Salesforce. These connectors typically run from $20 to a few hundred dollars a month, depending on data volume.
Power BI vs Data Studio: UI/UX, performance, and other considerations
Adoption takes effort no matter how useful a new tool is, and daily experience with the platform matters regardless of a team's technical proficiency. The sections below cover where Power BI and Looker (Data Studio) shine in dashboard development, and where each falls short.
Report-building UI
Data Studio: Simple drag-and-drop interface with an editing sidebar, built for non-technical users, quick chart creation without a coding background.
Power BI: More technical, built for data analysts. Requires understanding of data modeling, DAX (Data Analysis Expressions, a formula language for calculations), and star schema design to use its full capability.
Collaboration features
Data Studio: Google Docs-style sharing with link distribution, real-time simultaneous editing, and simple view-only or edit permission controls.
Power BI: Deep integration with Teams and SharePoint, granular role-based access control (admin, member, contributor, viewer). External sharing beyond the organization requires a Pro license.
Use cases
Data Studio: Client-facing reports, cross-team dashboards, and stakeholder presentations that don't require technical depth.
Power BI: Internal, analytics-heavy reporting with complex data requirements, typically run by a dedicated data team.
Data refresh and management
Data Studio: Caching and compression optimize performance; Pro supports up to 200 scheduled deliveries, with hourly delivery available. Live connections are supported but can slow performance.
Power BI: Granular refresh scheduling (8 refreshes a day on Pro, 48 on Premium Per User), DirectQuery for live connections, and stronger handling of complex data transformation workflows.
Security and compliance
Data Studio: Google-level security within the free and Pro tiers; Pro adds IAM/SSO, audit logs, and customer-managed encryption keys. Native row-level security isn't available, a common reason teams move to the enterprise Looker platform.
Power BI: Enterprise-grade security with row-level security, sensitivity labels, and integration with Microsoft's compliance framework.
Scalability and performance
Data Studio: Performance degrades on datasets over 100,000 rows, especially on the free tier. Real-time updates and quick campaign feedback loops remain a strength.
Power BI: DAX-driven transformations handle complex, large datasets with strong modeling capability, built for enterprise-scale analytics.
“Data Studio does slow down with datasets over 100k+ rows. To make up for this limitation, you can pair it with BigQuery as your data warehouse, with Looker as the visualization layer. Whether you actually need this enforcement depends on three factors: Where does your data live? Is it located in one place or scattered across multiple sources? And do you need to “normalize” it before visualization?
If your data sits in one place and is already clean, you can go straight to Data Studio. If you're dealing with multiple data sources that need combining, cleaning, or complex transformations, you probably need a data warehouse like BigQuery to handle it all.”
— Bohdan K., business analyst at Brights
How does it work in practice? When our team built analytics for a booking app tracking apartment reservations, occupancy rates, and booking patterns, the raw data was scattered across multiple tables and needed extensive transformation. So, we used BigQuery to calculate booking duration differences, merge reservation tables with property data using complex joins, and cross-reference customer behavior patterns before sending the clean, aggregated data to Data Studio for visualization. Without BigQuery handling the heavy data processing, Looker Studio would have struggled with the volume and complexity of calculations required.
Bringing a third option into the discussion: Tableau
Tableau enters the comparison for companies that weigh visualization quality and analytical depth as heavily as ecosystem fit and cost. Gartner named Microsoft, Salesforce (Tableau), and Google all Leaders in its 2025 Magic Quadrant for Analytics and BI Platforms, with Microsoft holding the top position in Ability to Execute for the seventh consecutive year.
Base price: Creator $75, Explorer $42, Viewer $15 per user/month, billed annually.
Target audience: analysts and business users who prioritize visualization depth over ecosystem lock-in.
Native connectors: dozens per Tableau's own documentation, extensible through ODBC/JDBC and the Tableau Exchange.
Learning curve: straightforward for basic charts, steeper for advanced calculations.
Row-level security: native, with centralized management through the Data Management add-on.
Best for: visualization-heavy reporting and exploratory analysis.
Tableau's list price sits well above both alternatives, but the gap narrows for teams that already pay for advanced visualization elsewhere. Migration data from Enlyft, tracked across more than 2,600 organizations in 2025, found companies moved from Tableau to Power BI at roughly twice the rate of the reverse migration, a trend tied largely to the price difference and Microsoft's ecosystem bundling.
"Software licenses are the tip of the iceberg when choosing between Data Studio, Power BI, and Tableau. A free tool like Data Studio can still run $1,000 or more a month in paid connectors, on top of weeks of consultant setup time. Power BI's license is predictable, but training and IT support can double the real cost. Tableau's higher list price includes more built-in capability, which sometimes offsets the connector and training costs the other two require.
Brights models these hidden costs upfront when planning a client's analytics stack, which avoids the surprises that tend to surface three to six months after launch."
— Brights’ data analytics team
In the table below, we’ve gathered the most critical pricing considerations.
| Cost category | Looker Studio | Power BI | Tableau |
|---|---|---|---|
| Base license | Free for a basic version or $9/user/month for Pro version | $14/user/month for Pro version or $24/user/month for PPU (Premium Per User) | Creator $75, Explorer $42, Viewer $15 per user/month, billed annually |
| Marketing connectors | $30-49/month per individual connector (Facebook, HubSpot, etc.) | Most essential connectors included; specialized connectors cost extra | Limited native marketing connectors; relies on the Tableau Exchange or third-party tools |
| Connector packages | Supermetrics: €29-399/month for multiple sources | Custom development or vendor solutions required | Third-party connector packages available through the Tableau Exchange |
| Admin overhead | Minimal: self-service sharing and permissions | Significant: workspace management, security, governance | Moderate to significant, scales with the Data Management add-on |
| IT support needs | Low: mainly connector troubleshooting | High: enterprise deployment, user management, compliance | Moderate to high, depending on deployment scale |
Which tool is best for your case?
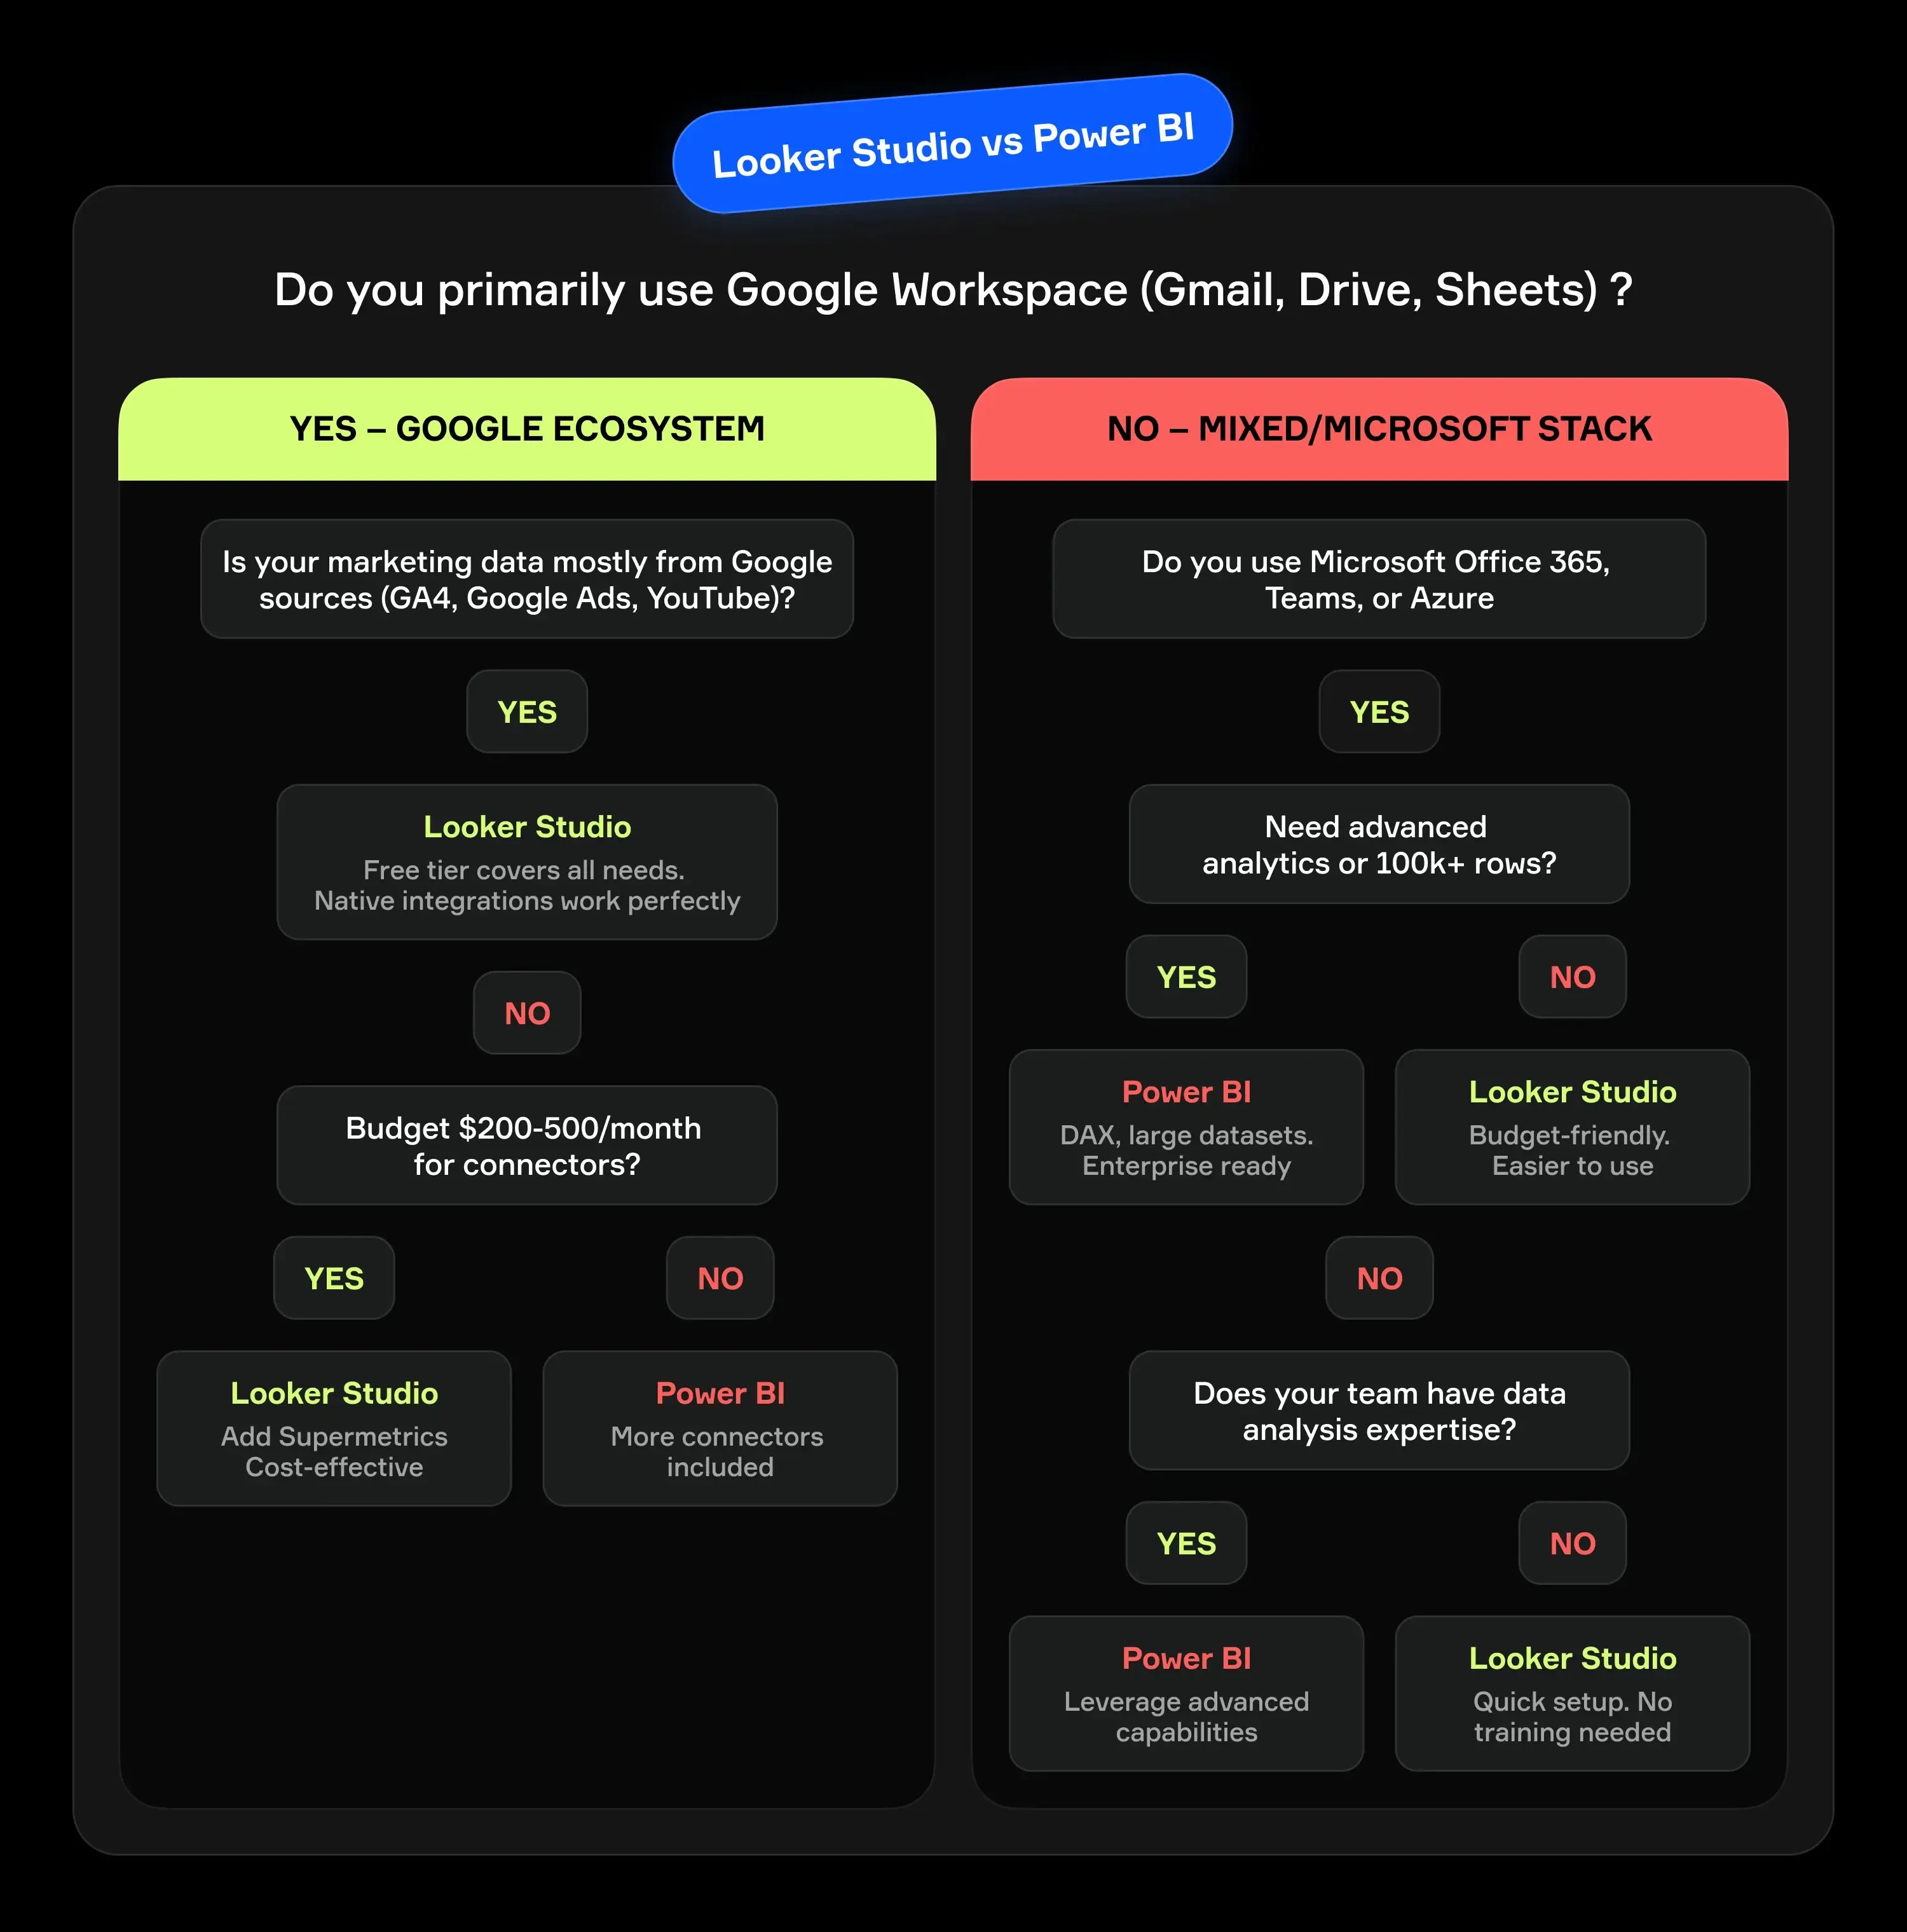
So, which is better: Power BI, Data Studio, or Tableau? The answer depends on ecosystem, technical background, budget, and future plans. Data Studio suits Google-centric teams that want cost-effective, easy-to-use analytics. Power BI fits teams that need enterprise-grade data modeling and Microsoft ecosystem integration. Tableau fits teams that prioritize visualization depth and interactive exploration over ecosystem lock-in.
Budget matters here too: the real implementation cost extends beyond licensing, since connector fees, training time, and ongoing maintenance all factor into the total.
Choosing among three platforms adds complexity, and that's where Brights steps in. Whether the need is Data Studio setup, Power BI implementation, or a Tableau rollout, Brights' analytics team has guided companies across industries through the transition, starting from actual daily workflow rather than a generic template.
FAQ.
Data Studio is free for basic use with Google's native connectors: GA4, Google Ads, and Google Sheets. Third-party connectors for platforms like Facebook Ads or HubSpot cost $30-49 a month per connector, which adds up for teams that need a complete picture of marketing performance.


